Your Place, Your Priorities: Introducing Personalized Reports

When I launched the Analyze feature a few weeks ago, I was excited to offer comprehensive location analysis reports covering everything from assessed values to crime statistics to accessibility metrics. The data was accurate, thorough, and covered all the key factors anyone would need to evaluate a location.
But as I used the feature myself and watched how others engaged with it, I noticed something: the reports covered all the essentials, but they weren't personal. A growing family with young children got the same analysis as a real estate investor looking for development opportunities. The same crime statistics. The same accessibility metrics. The same demographic breakdown.
The data told you what was there, but not what it meant for you.
Today, I'm excited to introduce personalized reports; the same comprehensive data you've come to expect, but analyzed through the lens of who you are and what you need.
The Problem
Let's take a look at an example of a one-size-fits-all report. This is what a Standard report used to say about 604 Memorial Drive NW in Sunnyside:
Property value overview (Before):
This Detached property demonstrates strong value positioning within Sunnyside, an established inner-city community in Calgary. The property shows resilient market performance with 3% year-over-year growth, while the compact 3,580 sq ft lot reflects the neighborhood's urban density and redevelopment potential.
It's accurate. It's thorough. But who is this for? Is "redevelopment potential" relevant to the family with a toddler looking for their first home? Does a remote worker care about the same things as a real estate investor?
The data was there, but the interpretation was generic.
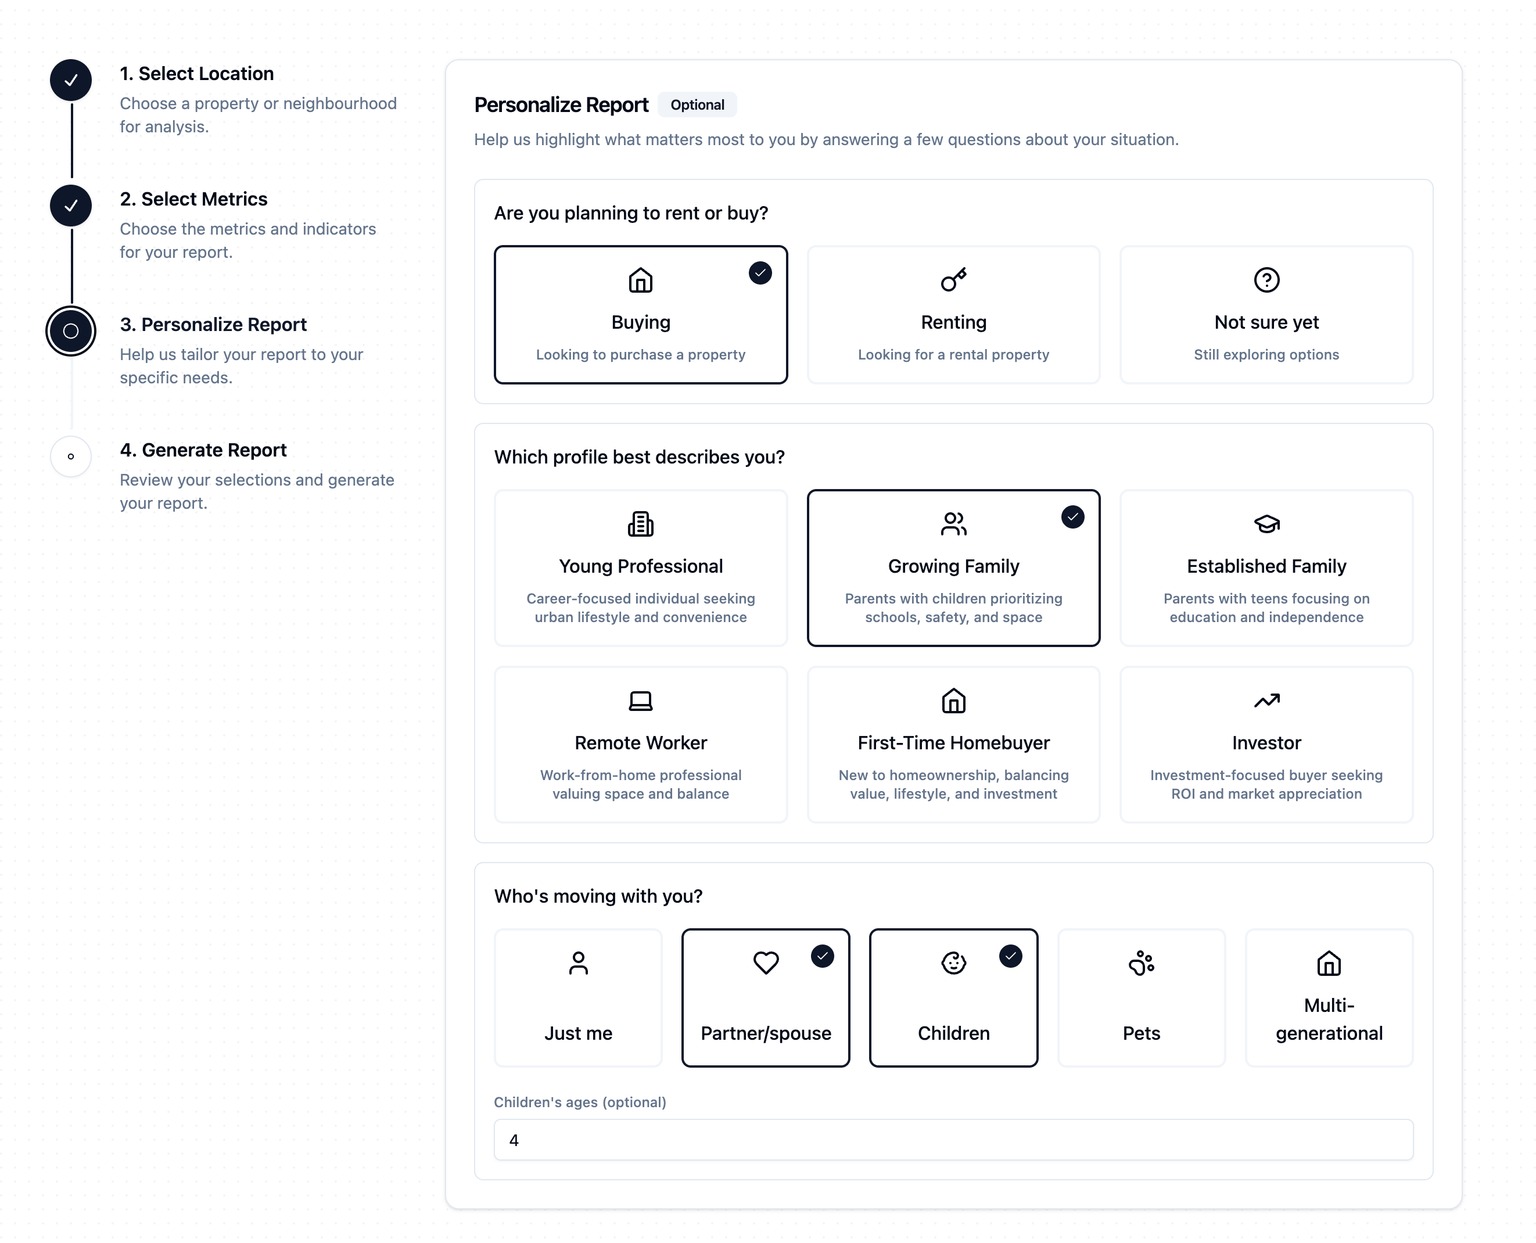
The Solution
After analyzing a lot of reports and talking to users about how they evaluate locations, I realized that three key factors fundamentally change how you should interpret data:
- Are you planning to rent or buy?
- This determines whether you need to know about down payments and long-term appreciation, or monthly costs and lease flexibility
- Which profile best describes you?
- Young Professional
- Growing Family
- Established Family
- Remote Worker
- First-Time Homebuyer
- Investor
- Who's moving with you?
- Just me
- Partner/spouse
- Children
- Pets
- Multi-generational
These three simple questions reshape every section of your report. Same data sources, same metrics, but the analysis becomes relevant to your specific situation.
Personalization in Action
Let me show you what this means with real examples. I'll use the same location, 604 Memorial Drive NW in Sunnyside, and show how the analysis changes completely based on whether you're a "growing family" or an "investor".
Same location, same data sources, but different conclusions and insights.
Property Value Analysis
Generic Report (Before):
This Detached property demonstrates strong value positioning within Sunnyside... The property shows resilient market performance with 3% year-over-year growth, while the compact 3,580 sq ft lot reflects the neighborhood's urban density and redevelopment potential.
What does "redevelopment potential" mean for your family budget? And what's "strong value positioning" in practical terms?
Growing Family Profile (After):
As parents with your 4-year-old child, this detached home in Sunnyside offers an established inner-city community with strong family appeal.
Your financial requirements:
- Estimated Down Payment: $113,100 (20% of assessed value, typically 3-4 years savings)
- Combined Annual Income Needed: $157,083
- Monthly Housing Cost: $4,365 (mortgage $3,565 + taxes/insurance $800)
- Renovation Budget: $45,000-75,000 (5-7 year strategic improvements)
Your estimated monthly housing cost of $4,365 represents approximately 33% of the required $157,083 household income, leaving room for your childcare expenses and family savings goals.
Now you have actionable numbers. Exactly what income you need. What your monthly budget looks like. How much to save for renovations. This is information you can actually use to make a decision.
Investor Profile (After):
R-CG zoning provides significant development flexibility, permitting rowhouses, duplexes, and secondary suites with allowance for secondary suites. For investment purposes, the immediate opportunity lies in developing a legal secondary suite ($60,000-80,000 investment) to generate $1,800-2,400/month rental income.
Longer-term redevelopment opportunity involves converting the 3,580 sqft lot into side-by-side configuration—two units generating independent revenue streams with projected ROI of 18-24% over 7-10 year hold period.
Sunnyside shows moderate development activity with 13 current permits (3% rate) and declining future activity (20 permits, 5% rate), positioning the neighborhood in steady regeneration mode—sufficient to maintain vibrancy without overwhelming existing character.
The zoning designation and lot dimensions don't change, but suddenly you're seeing cash flow projections, ROI timelines, and rental income scenarios instead of family budgeting advice.
Safety Assessment
Generic Report (Before):
Sunnyside's overall crime rate of 30.02 per 1,000 residents is 143% higher than Calgary's city average of 12.35, indicating elevated crime activity in this community. Emergency service access is exceptionally strong with 2.84 facilities per 1,000 residents, significantly exceeding Calgary's city average of 0.06.
Does "143% higher" mean it's dangerous for kids? Or just that you should install a security system? The numbers don't tell you.
Growing Family Profile (After):
As parents with a 4-year-old, Sunnyside presents a mixed safety profile requiring careful consideration.
Excellent for children:
- Zero pedestrian incidents in 2024 (down from 2 in 2023)
- 1,009 street lights (239 per 1,000 residents, 219% above city average)
- 3-minute emergency response times
- Exceptional infrastructure for evening family walks
Concerns:
- Crime rate 143% above city average
- 9 dwelling break-ins in 2024 (up 50% from 2023)
- Home security system recommended ($1,500-3,000)
Your child's outdoor safety is excellent given eliminated traffic risks and superior lighting. However, home security investments are essential before move-in.
Overall safety score for growing families: 67/100
- Strong for child activities
- Moderate for property protection
Now you have answers to the questions that actually matter for your family. Can your child play outside safely? Yes, with excellent lighting and zero traffic incidents. Should you invest in a security system? Absolutely, budget $1,500-3,000.
Investor Profile (After):
Crime rate 143% above city average but declining 50% over 5 years—improving trend supports value appreciation and tenant demand.
Property crime concentration (not violent crime) suggests security upgrades ($1,500-3,000) are marketing necessities for future tenants/buyers but don't indicate fundamental neighborhood deterioration.
Superior infrastructure (street lighting 219% above average, 3-minute emergency response) and rapid improvement trajectory position Sunnyside favorably for rental/resale despite current elevated crime statistics. Security features become selling points rather than deterrents.
One person reads "143% above city average" and worries about their toddler's safety. Another sees a 50% five-year decline and spots a neighborhood on the upswing—perfect for long-term appreciation.
Access to Services & Amenities
Generic Report (Before):
Walking provides 21 essential services within 15 minutes, 57% above Calgary's average of 13.36 and matching Sunnyside's community standard. Walking accessibility provides 24 essential services, matching Sunnyside's 21 average and exceeding Calgary's 13.36 average by 80%.
What does "21 essential services" mean when you're trying to figure out if you need one car or two? Or whether you can walk your kid to school?
Growing Family Profile (After):
Your family will require two vehicles for daily needs. Here's why:
Requires driving:
- School drop-offs (zero walkable elementary schools vs. city average of 4.18)
- Weekly grocery shopping with 4-year-old
- Organized activities and sports
- Bulk shopping needs
Walkability:
- 8 grocery stores (15-min walk) for quick items
- 39 restaurants/cafes for family dining
- 24 playgrounds and parks for daily outdoor play
Transportation cost: Annual vehicle cost: $12,100-16,500 for 2 vehicles
While Sunnyside offers excellent walkability for quick errands, raising a 4-year-old here requires vehicle transportation. Budget for two-car household.
This tells you exactly what you need to know: you'll need two cars, and here's what that will cost you annually. No guessing about whether the walkability score means you can ditch the second vehicle.
Remote Worker Profile (After):
Where can I work when I need a change of scenery?
Within 15-minute walk:
- 39 cafes and restaurants (many WiFi-friendly)
- 2 coworking spaces
- 3 libraries
Within 15-minute bike:
- 473 cafes/restaurants
- 24 coworking/study spaces
Work-from-home economics: Monthly Cost: $4,365 vs. Downtown Office: $800-1,200/month Annual Savings: $9,600-14,400 by eliminating office commute
Exceptional variety for breaking up home office monotony without commute time.
The family is counting schools within walking distance. The remote worker is counting cafes with WiFi. Different questions, different priorities, different insights from the exact same accessibility data.
Census & Demographics
Generic Report (Before):
Population composition: 764 residents in a high-density neighborhood (3,335 per sq km) with diverse household types including 61.2% family households. Age profile: Median age of 38 years, 1% lower than community (38.4) and 2% lower than city (38.8), indicating a slightly younger demographic.
Who will your neighbors be? Will your kid have friends their age? Is this a community of professionals or retirees?
Growing Family Profile (After):
Who will be your neighbors?
Sunnyside demonstrates strong family-oriented characteristics:
Family presence:
- 18.4% children (0-14 years) vs city 18.0%
- 122% more family households than typical urban neighborhoods
- Average 1.8 children per family
Education & values:
- 53.2% hold university degrees (vs 31.7% citywide)
- Professional concentration (60.3%) in business, education, sciences
- Education-focused community where parents prioritize children's academic achievement
Household economics:
- 51.5% earn over $100K
- Similar income levels create stable socioeconomic environment
What this means for your 4-year-old: Your daughter will grow up among educated, achievement-oriented families who prioritize children's development. The high concentration of university-educated parents creates a community where educational values align with raising motivated children.
This answers the question every parent asks: will there be other kids for my child to play with, and what kind of families are they? The answer: yes, lots of families with similar values around education and achievement.
Remote Worker Profile (After):
Who are my work-from-home neighbors?
- 22.6% work in business, finance, administration
- 23.3% walk to work (likely remote workers or local employment)
- 69.8% commute under 30 minutes
- 28% use active transportation (walking 23.3%, cycling 4.7%) vs city 4.2%
This neighborhood has a high concentration of professionals, many likely working from home or hybrid schedules—potential for professional networking and collaborative opportunities.
Commute efficiency: Short commutes (69.8% under 30 min) save 250 hours yearly compared to 45+ minute suburban commutes, reclaiming six work weeks for focused work time.
Where the family sees "university-educated parents" as potential playdate connections, the remote worker sees potential collaborators and networking opportunities in those same education statistics.
How It Actually Works
You might be wondering: is this just AI rephrasing the same information? Not exactly. The underlying data sources remain the same: municipal assessment databases, police crime statistics, OpenStreetMap, and Statistics Canada. What changes is the analytical framework applied to that data.
Here's what happens behind the scenes when you generate a personalized report:
Step 1: Profile weighting
Each profile has different metric weights that determine what gets emphasized. For example:
- Growing family: Schools, parks, child safety, traffic safety
- Remote worker: Dining, cafes, recreation, parks, work-life balance
- Investor: Development potential, ROI calculations, market trajectory, rental income analysis
Step 2: Household context
Your household composition adjusts the practical calculations:
- With children: School catchments, playground density, child-specific safety metrics, family vehicle costs
- With partner: Dual-income affordability calculations, two-vehicle household budgets
- Multi-generational: Accessibility features, healthcare proximity, space requirements
Step 3: Intent-based analysis
- Buying: Down payment requirements, long-term value appreciation, renovation ROI, neighborhood development trajectory, investment horizon considerations
- Renting: Monthly costs, lease flexibility, short-term neighborhood trends, rental market conditions, mobility considerations
- Not sure: Balanced view of both ownership and rental scenarios to help inform your decision
The same crime rate of "30.02 per 1,000 residents" triggers completely different analysis:
- Growing family: it focuses on pedestrian incidents, street lighting, outdoor child safety
- Investor: it focuses on 5-year crime trends, impact on tenant demand, property appreciation trajectory
This is reinterpreting the data through the lens of what actually matters for your situation.
Try It Yourself
If you'd like to give it a try, follow these steps:
- Visit PickYourPlace.app/analyze
- Pick a location
- Choose the metrics you're interested in
- Select the profile that best describes you
- Choose a report tier and generate your report
As always, I'd love to hear your feedback. What works? What doesn't? What other profiles or customizations would be helpful? Your input has shaped PickYourPlace from the beginning, and it will continue to guide where we go next.
Find your neighbourhood match in 60 seconds.
Answer 6 questions, the data suggests a Canadian neighbourhood that fits your priorities and budget. Public, shareable, no signup.