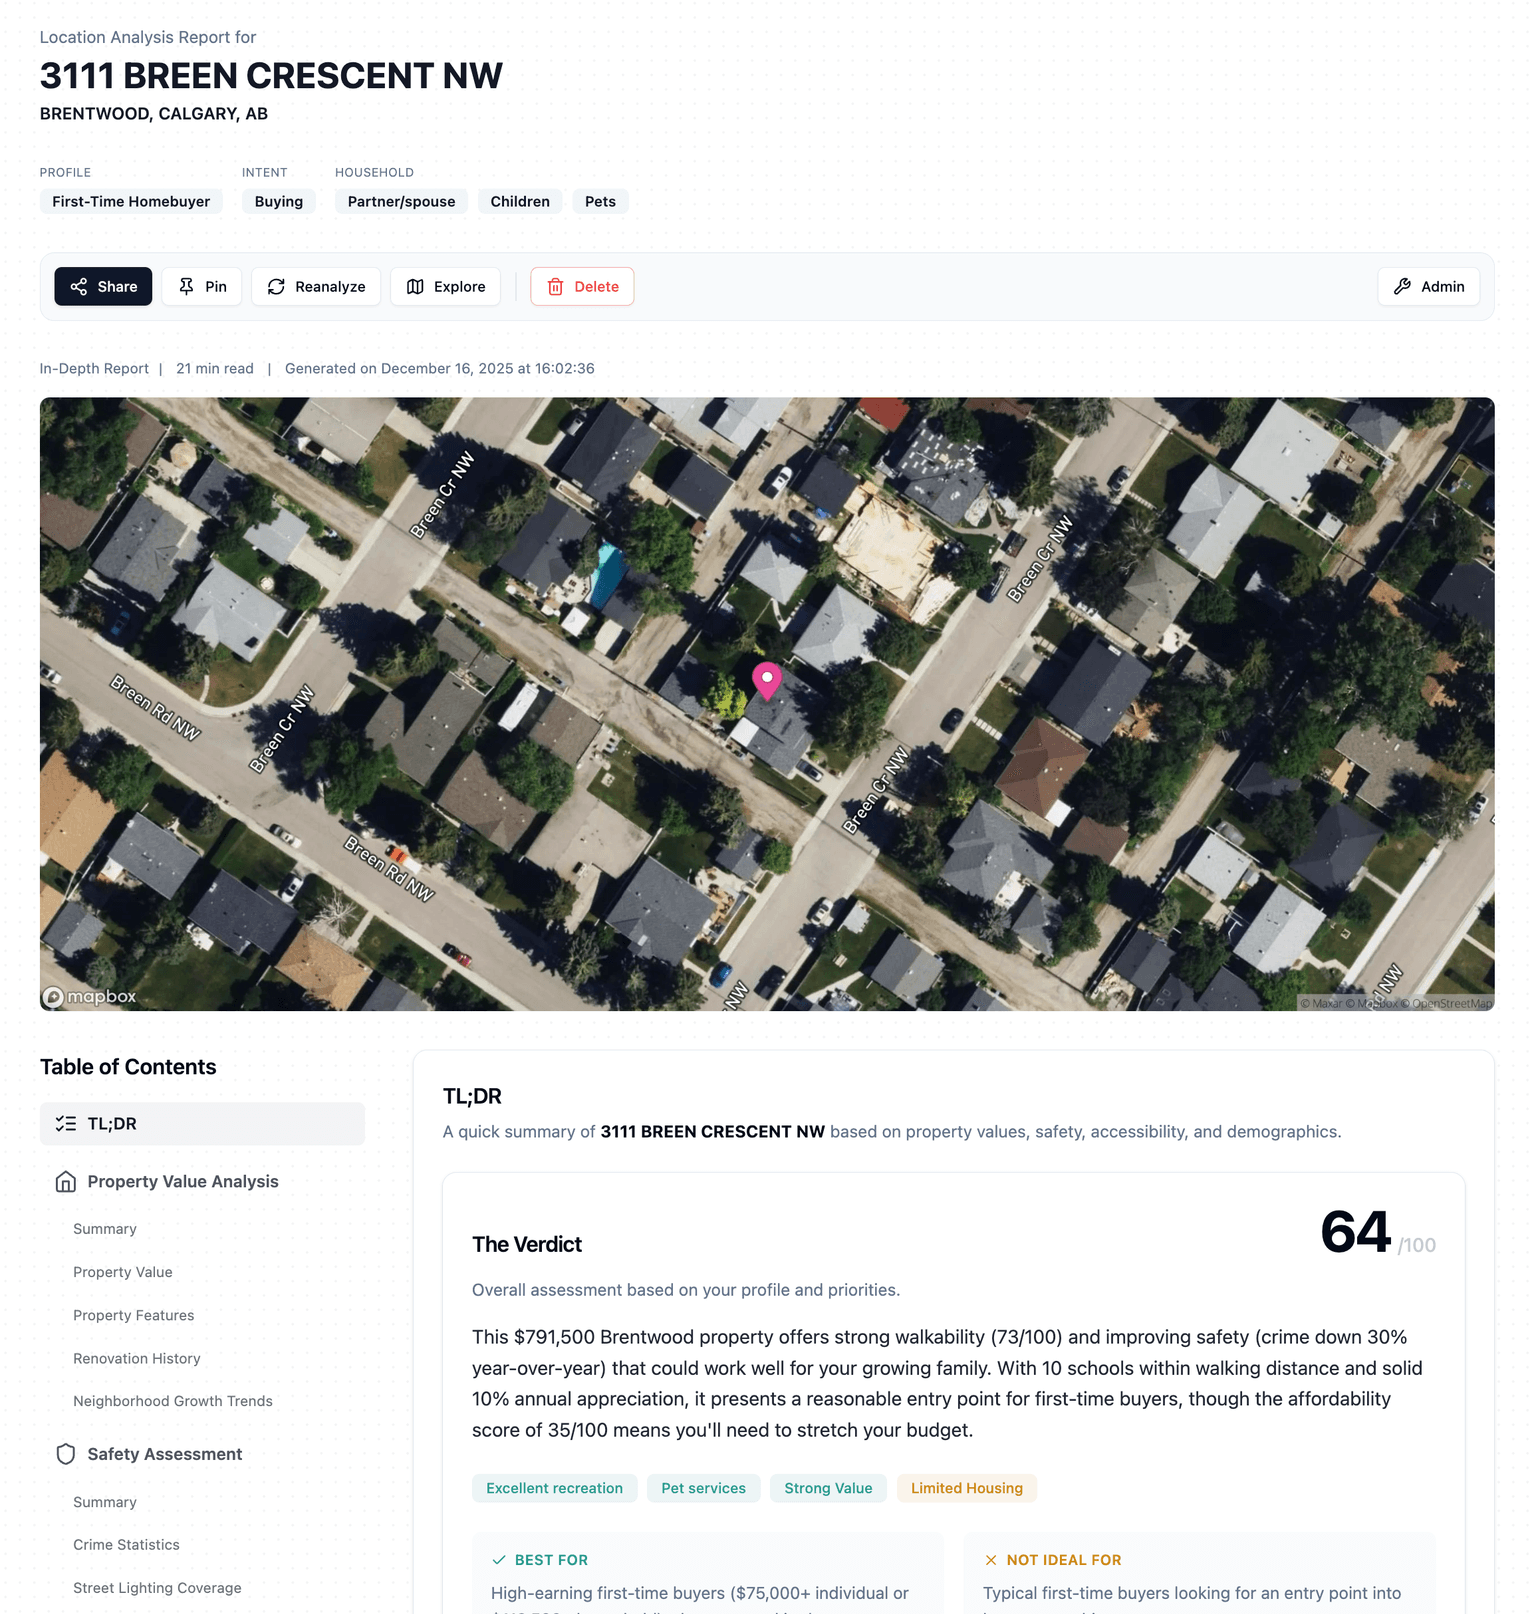
Smarter Reports: TL;DR Summaries, Quick Scores, and Personalized Insights

When we launched PickYourPlace, our goal was simple: help people make informed decisions about where to live by providing comprehensive property and neighborhood data. But comprehensive doesn't have to mean overwhelming.
After receiving feedback from one of our first paying customers—a Toronto resident relocating to Calgary—we realized something important. Our reports were thorough, but they were also a lot. Pages of data, detailed comparisons, extensive metrics. Great for deep research, but not ideal when you're trying to quickly assess whether a property is worth a closer look.
So we rebuilt our reports from the ground up. Here's what's new.
The TL;DR Section: Your 2-Minute Decision
Every report now opens with a TL;DR (Too Long; Didn't Read) section that gives you the essential verdict in under two minutes. No scrolling through pages of data to understand whether a property fits your needs.
Here's what you'll find:
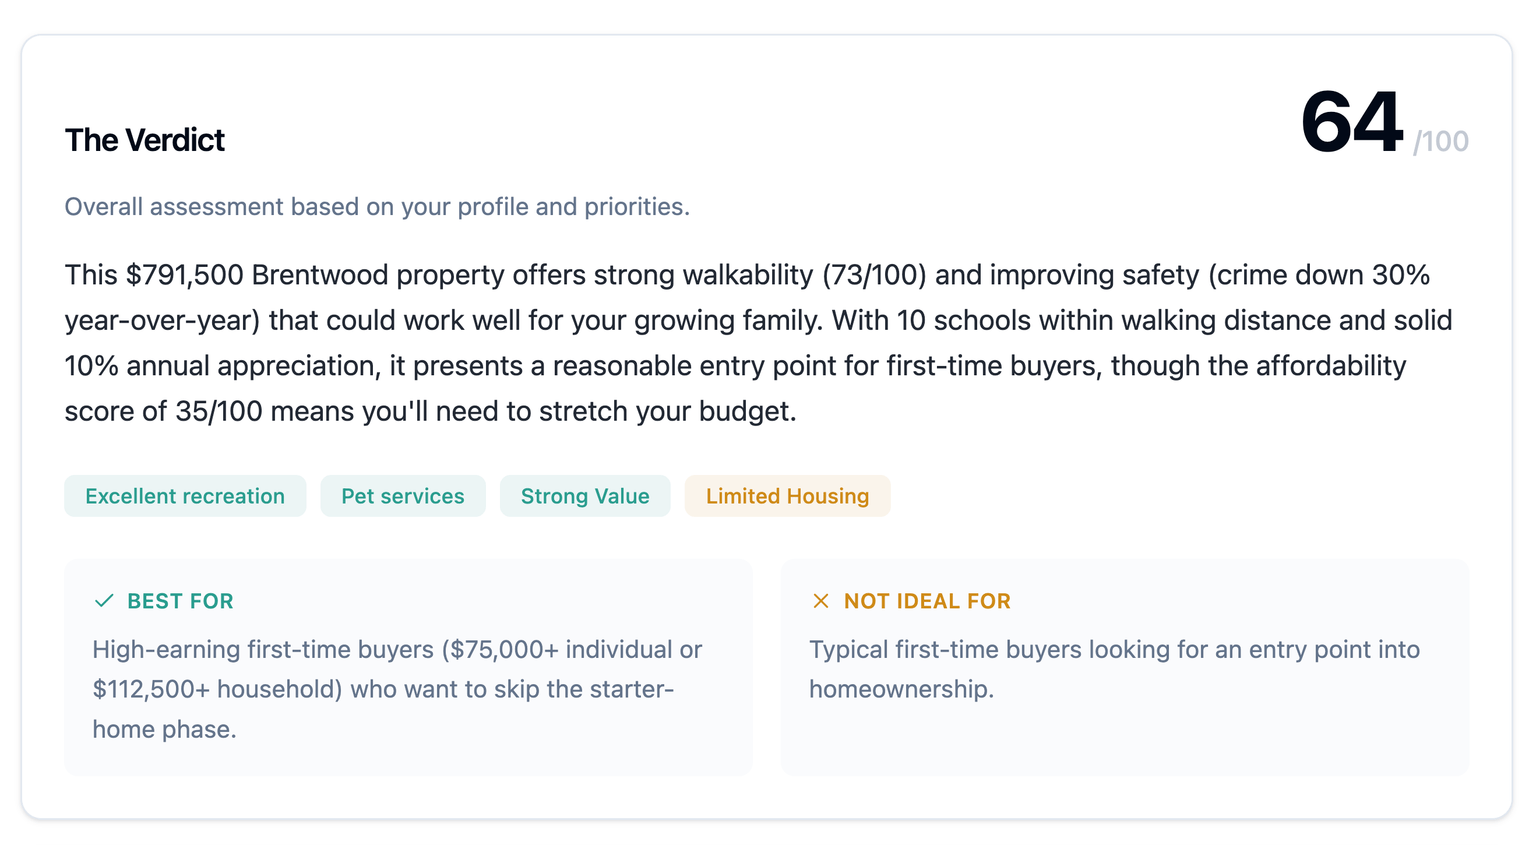
The Verdict
A clear, personalized assessment that cuts straight to the point:
This $791,500 Brentwood property offers strong walkability (73/100) and improving safety (crime down 30% year-over-year) that could work well for your growing family. With 10 schools within walking distance and solid 10% annual appreciation, it presents a reasonable entry point for first-time buyers, though the affordability score of 35/100 means you'll need to stretch your budget.
We also tell you who this property is best for—and who should probably look elsewhere:
- Best for: High-earning first-time buyers ($75,000+ individual or $112,500+ household) who want to skip the starter-home phase
- Not ideal for: Typical first-time buyers looking for an entry point into homeownership
No more guessing. No more reading between the lines.
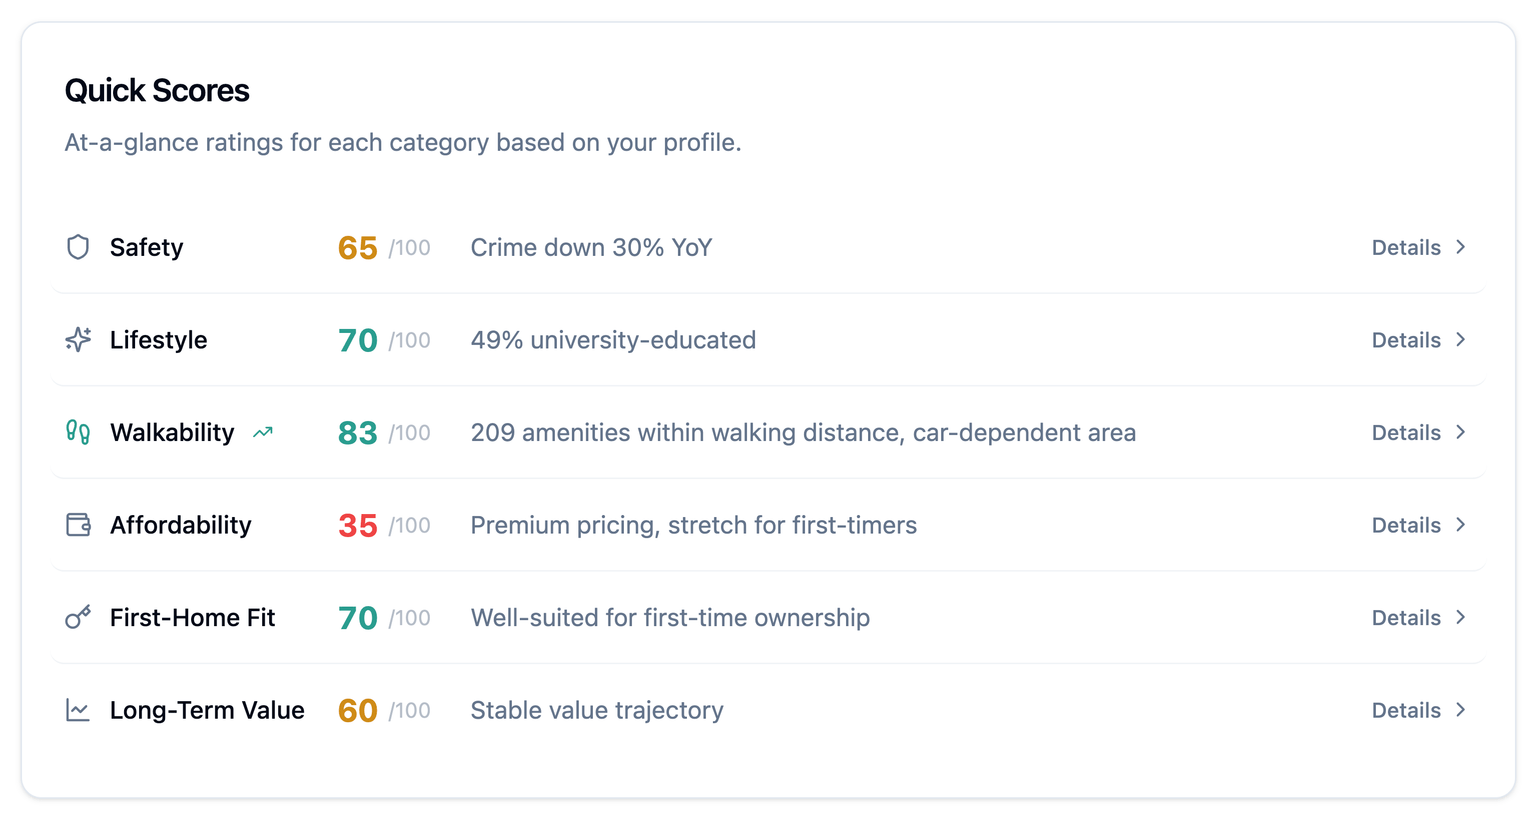
Quick Scores
At a glance, see how the property performs across the metrics that matter most:
| Category | Score | Summary |
|---|---|---|
| Safety | 65/100 | Crime down 30% YoY |
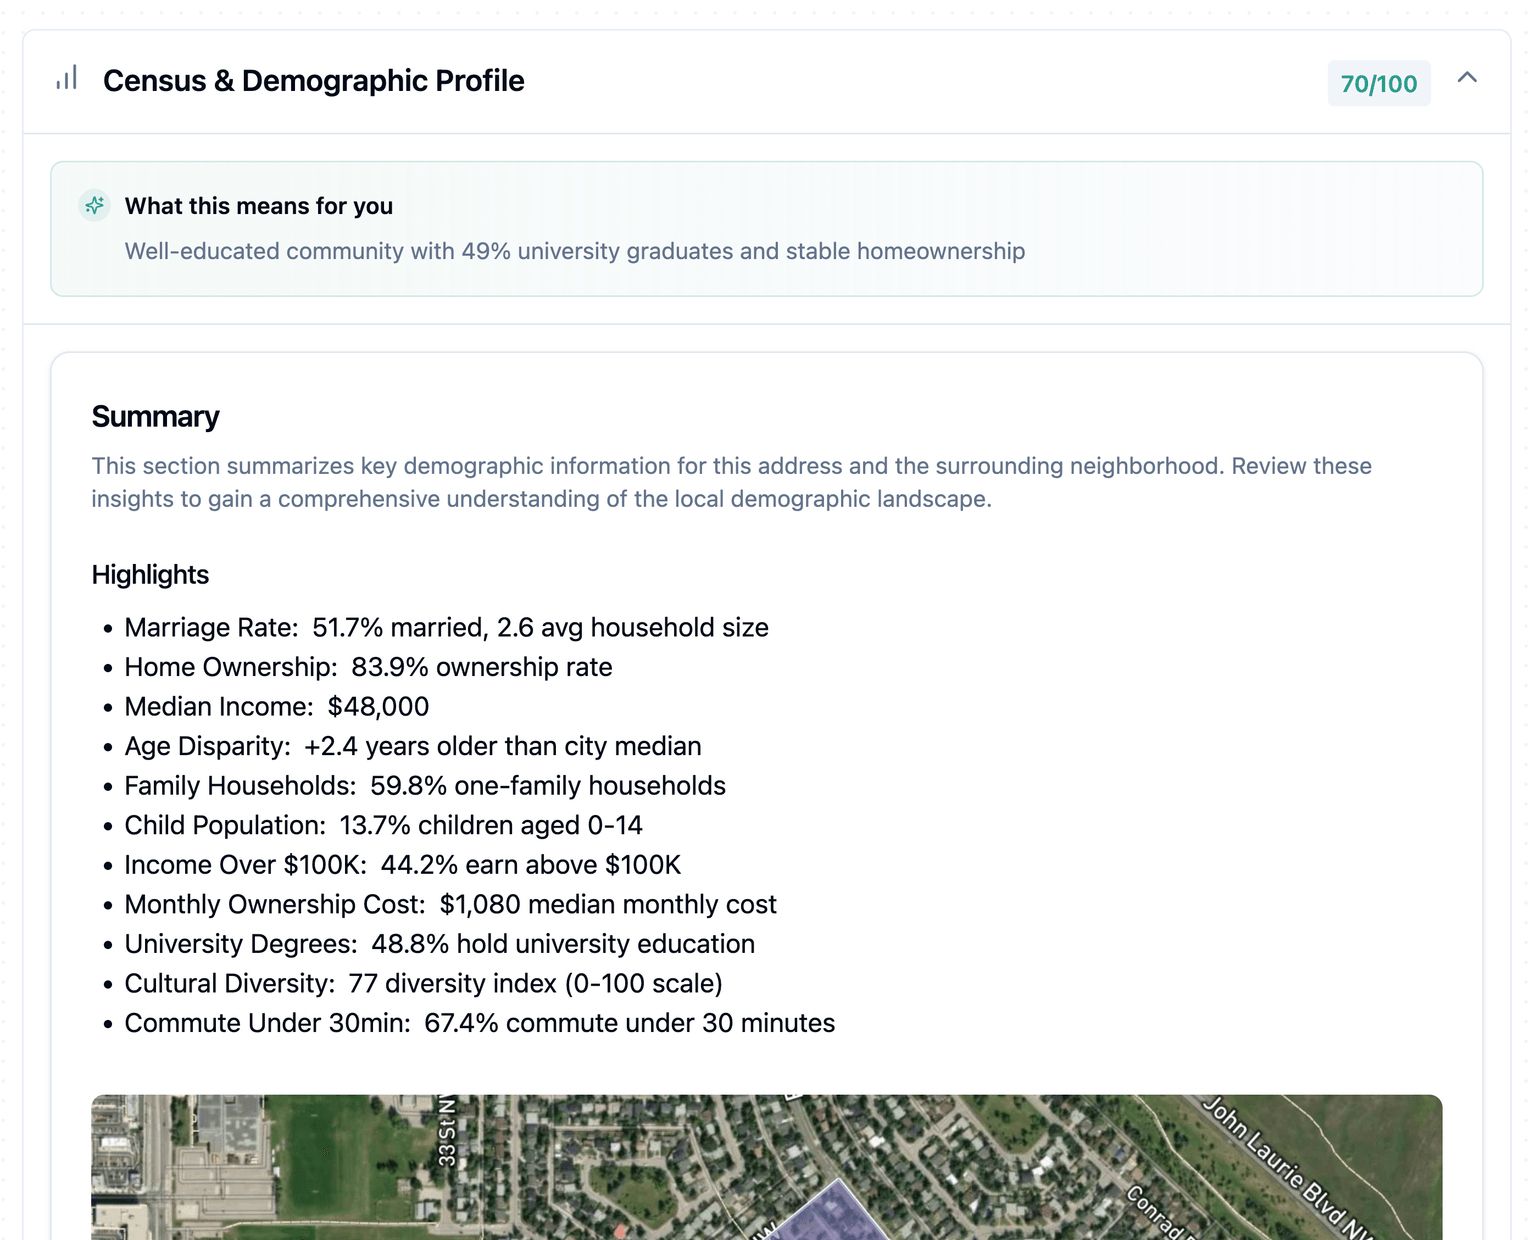
| Lifestyle | 70/100 | 49% university-educated |
| Walkability | 83/100 | 209 amenities within walking distance |
| Affordability | 35/100 | Premium pricing, stretch for first-timers |
| First-Home Fit | 70/100 | Well-suited for first-time ownership |
| Long-Term Value | 60/100 | Stable value trajectory |
These scores are calibrated to your profile. A "Growing Family" sees school and safety scores prominently. A "Young Professional" would see transit and dining scores instead.
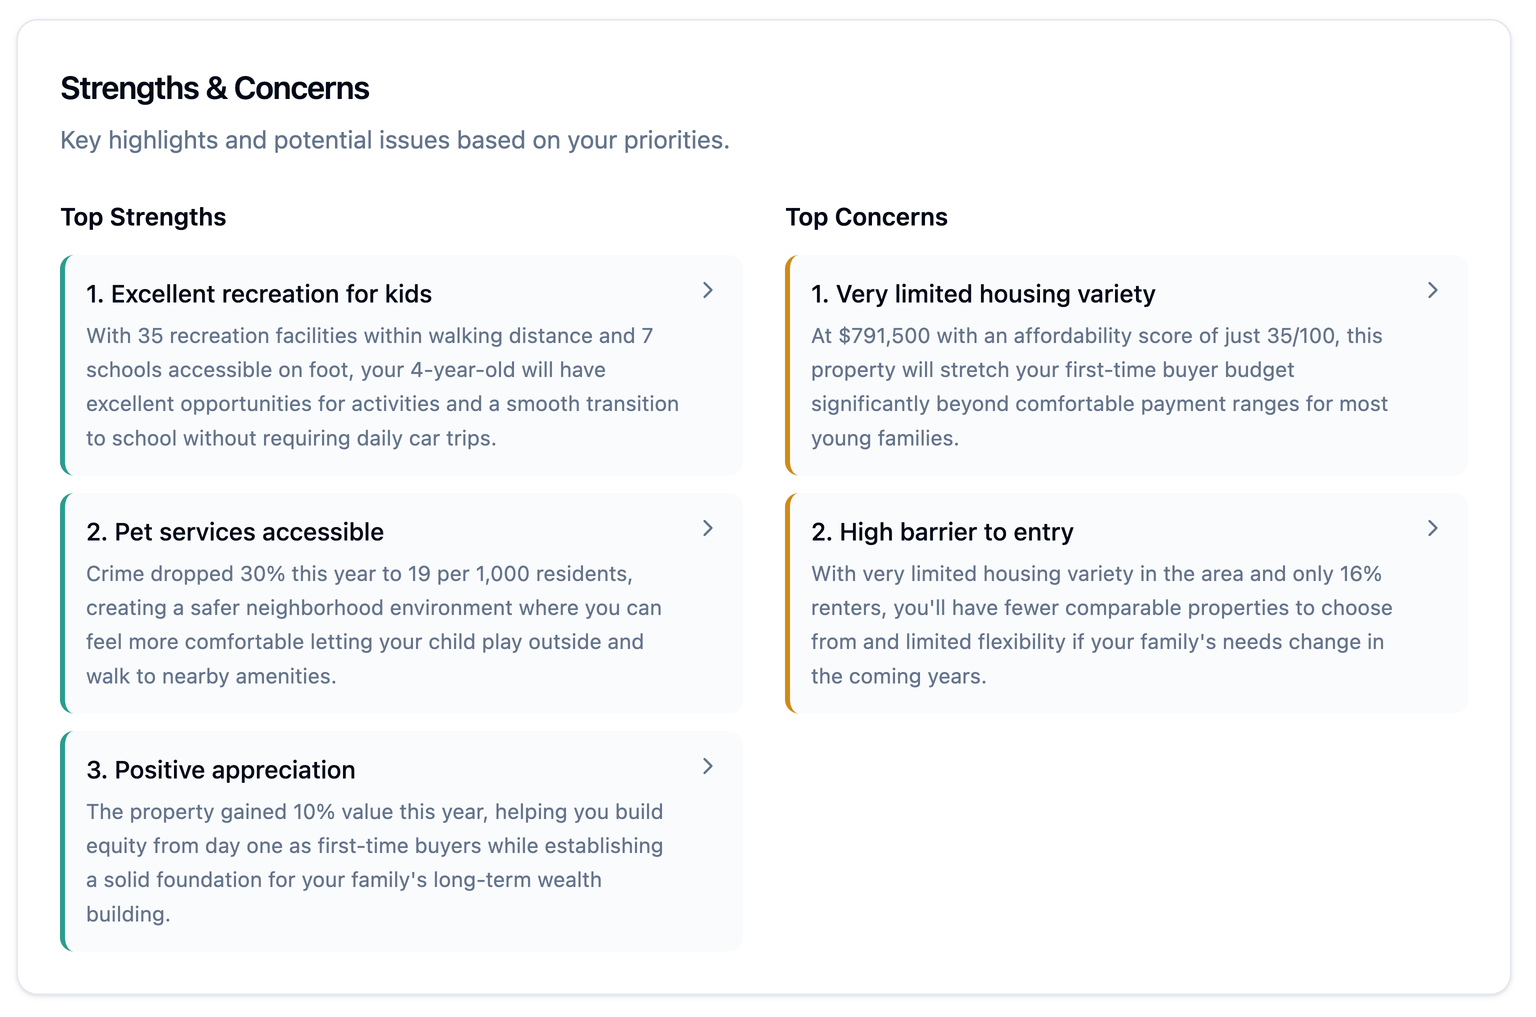
Top Strengths and Concerns
We highlight the three biggest advantages and flag the most important concerns:
Top Strengths:
- Excellent recreation for kids—35 facilities within walking distance, 7 schools on foot
- Safety improving rapidly—crime dropped 30% this year to 19 per 1,000 residents
- Strong appreciation—10% value gain this year builds equity from day one
Top Concerns:
- Premium pricing—$791,500 with affordability score of 35/100 stretches first-time buyer budgets
- Limited housing variety—only 16% renters means fewer comparable properties to choose from
No burying the lead. You see what matters immediately.
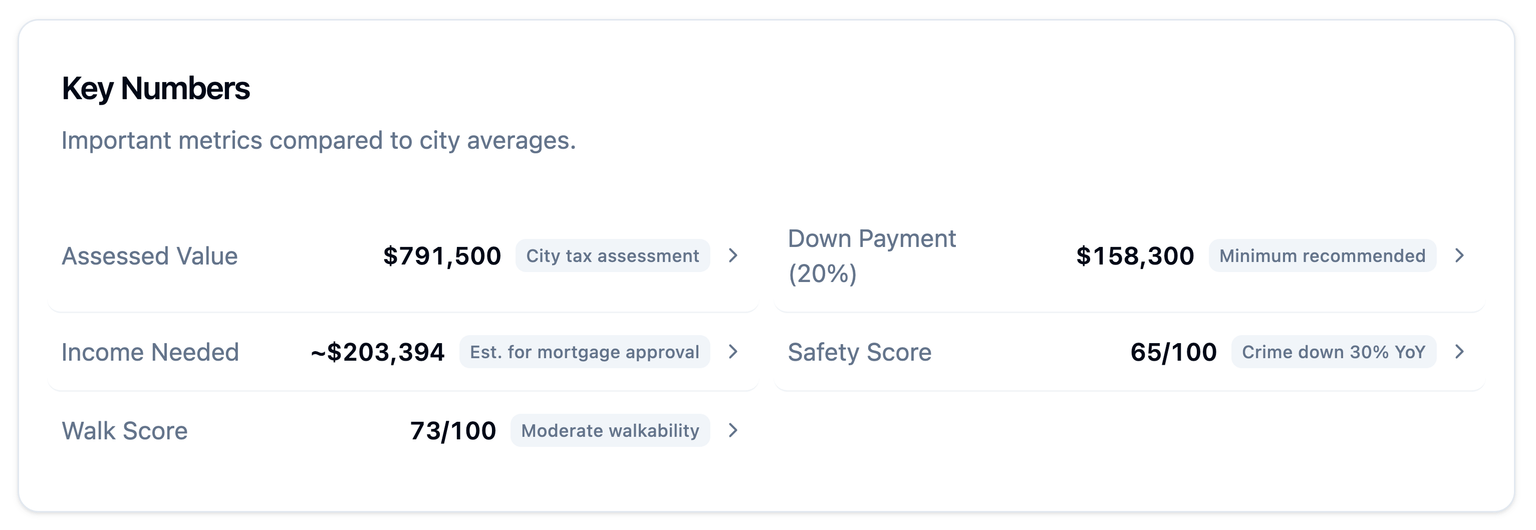
Key Numbers
Important metrics at a glance, compared to city averages:
| Metric | Value | Context |
|---|---|---|
| Assessed Value | $791,500 | City tax assessment |
| Down Payment (20%) | $158,300 | Minimum recommended |
| Income Needed | ~$203,394 | Est. for mortgage |
| Safety Score | 65/100 | Crime down 30% YoY |
| Walk Score | 73/100 | Moderate walkability |
These benchmarks help you instantly understand how a property compares to the broader market—no digging required.
Personalized to Your Situation
Every insight is tailored to who you are and what you're looking for.
Tell us you're a first-time homebuyer with a partner, children, and pets, and the report speaks directly to your priorities:
- "As first-time homebuyers with your partner and 4-year-old, this detached home represents a 38.7% premium over Calgary's typical assessed value..."
- "You would need an estimated $158,300 down payment (20% of assessed value) plus combined annual income of $220,000..."
- "With 35 recreation facilities within walking distance and 7 schools accessible on foot, your child will have excellent opportunities..."
This isn't generic data with your name pasted in. The analysis itself changes based on your profile, intent (buying vs. renting), and household composition.
Financial Clarity Upfront
One of the most requested features: clear financial requirements right at the top of the Property Value section.
| Item | Value |
|---|---|
| Estimated Down Payment | $158,300 (20% of assessed value) |
| Estimated Income Needed | $220,000 combined annual |
| Estimated Monthly Cost | $5,800 total (mortgage + taxes + utilities) |
| Renovation Budget | $40,000-60,000 (5-7 years for updates) |
Before you fall in love with a property, you'll know if you can actually afford it.

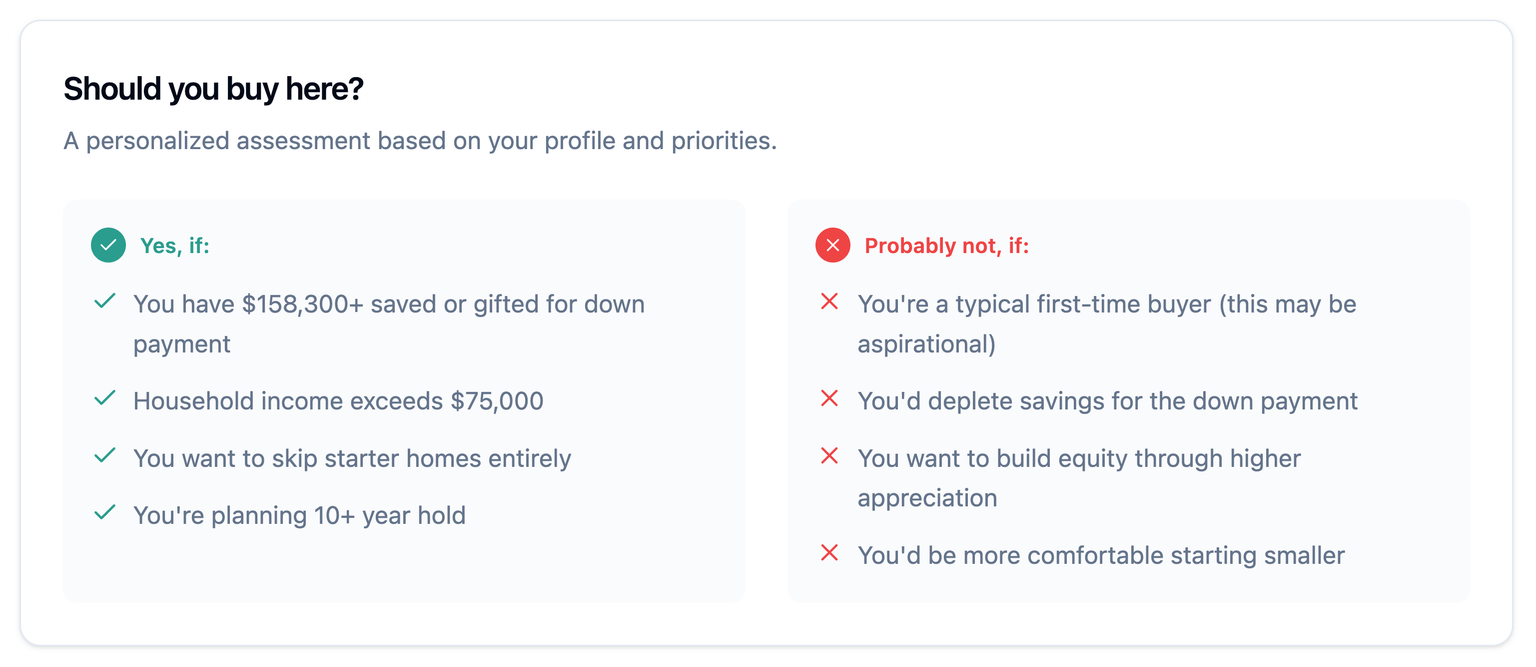
"Should You Buy This?" — Clear Guidance
At the end of the TL;DR, we give you actionable guidance:
Yes, if:
- You have $158,300+ saved or gifted for down payment
- Household income exceeds $75,000
- You want to skip starter homes entirely
- You're planning 10+ year hold
Probably not, if:
- You're a typical first-time buyer (this may be aspirational)
- You'd deplete savings for the down payment
- You want to build equity through higher appreciation
- You'd be more comfortable starting smaller
This is the kind of honest assessment you'd want from a trusted advisor—not a salesperson.
Section Scores Throughout the Report
Beyond the TL;DR, every major section now includes its own score. As you dive deeper into Safety, Property Value, or Access to Amenities, you'll see a clear score at the top of each section.
These scores give you immediate context before reading the details. A 65/100 Safety score shows promising improvement trends. A 35/100 Affordability score signals you'll need to stretch your budget.

More Concise Throughout
Beyond the TL;DR, the entire report is tighter. Every section now includes:
- Summary boxes with key numbers at a glance
- Comparative tables showing property vs. community vs. city
- Key Insights distilled to 2-3 bullet points per section
We kept all the depth for those who want it. But now you can skim effectively or dive deep—your choice.
Why We Made These Changes
One of our first paying customers, relocating from Toronto to Calgary, gave us invaluable feedback. They needed to make decisions quickly about multiple properties before booking expensive viewing flights. Reading 30-minute reports for each property wasn't practical.
The TL;DR section is specifically designed for this use case: screen properties fast, identify the best candidates, then use the detailed sections for the properties that make the cut.
Try the New Reports
Ready to see these improvements in action? Generate a report for any Calgary or Vancouver address and experience the difference firsthand.
What's Next
We're continuing to improve based on your feedback:
- Compare Module: Analyze multiple properties side-by-side with a unified comparison report. See how your top candidates stack up across every metric in one view.
- Chat Module: An AI companion that has full context about your selected properties. Ask questions, explore trade-offs, and get personalized recommendations through natural conversation.
Have feedback on the new report format? We'd love to hear it. Every improvement we make comes from real users like you.
Find your neighbourhood match in 60 seconds.
Answer 6 questions, the data suggests a Canadian neighbourhood that fits your priorities and budget. Public, shareable, no signup.