Is Beltline Calgary Safe? What 3 Years of Crime Data Shows
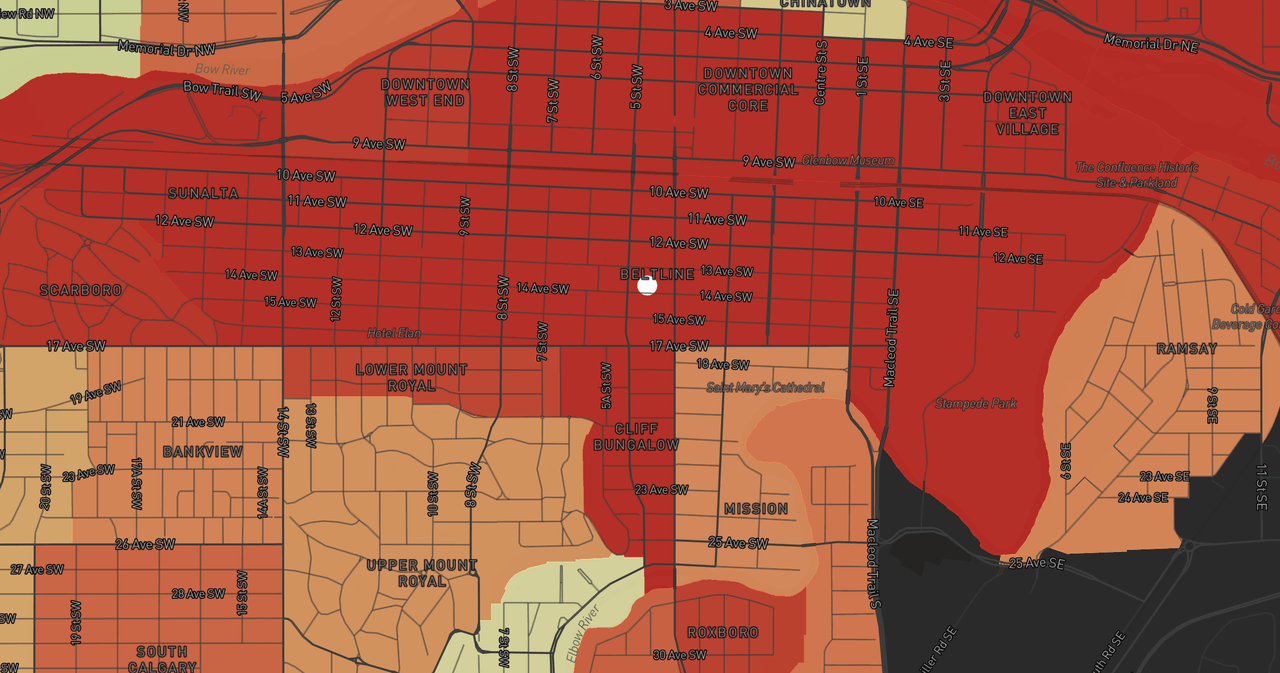
Data freshness: Calgary Police Service community crime statistics through year-end 2025. Population and demographics from the Statistics Canada 2021 Census. Property values from the City of Calgary 2026 assessment roll. Every neighbourhood figure below is pulled live from the PickYourPlace database. See the Methodology section for sources.
You've found a condo you like in Beltline. The price fits your budget, the walk to work is 12 minutes, and there's a grocery store across the street. Then someone at dinner says: "Beltline? Isn't that area kind of sketchy?"
If you're a first-time buyer in Calgary, you've probably heard some version of this. Beltline is one of Calgary's densest neighbourhoods, roughly 25,700 residents packed into about three square kilometres between the CP Rail tracks and 17th Avenue SW. Density means more reported incidents per square kilometre, and that creates a perception problem.
But is Beltline Calgary safe by the numbers? Here's what the Calgary Police Service data actually shows, and where the easy answer gets it wrong.
Beltline at a Glance
The honest headline is that Beltline pulls in two directions at once. It carries a genuinely high volume of reported crime, and it also offers some of the best walkability, transit, and emergency-service access in the city. A single safety score hides that tension, so here are the four numbers that matter most:
| Measure (2025) | Beltline | Context |
|---|---|---|
| Composite safety score | 31 / 100 | Among the lowest in the city (median 48); the crime component ranks 5th percentile, while police, fire, and health access all rank above the 80th |
| Reported crime rate | 54.3 per 1,000 | About 3.6 times the citywide rate of 15.2 per 1,000 |
| Three-year crime trend | Up about 5% (2023 to 2025) | Citywide reported crime fell about 21% over the same window |
| Accessibility score | 90 / 100 | Among the city's most accessible communities; transit near the top citywide |
Those numbers do not resolve into a tidy verdict, and that's the point. Beltline ranks high on reported crime, near the bottom on noise, and near the top on access and emergency response. The rest of this post unpacks each of those, because the decision lives in the detail, not the headline.
How Beltline Compares to Inner-City Calgary
Calgary Police Service publishes community-level incident counts every year. PickYourPlace's Safety lens on the Explore map turns those counts, along with street lighting, traffic, noise, and emergency-service proximity, into a 0-to-100 safety score for every Calgary neighbourhood.
Beltline's composite safety score is 31 out of 100, among the lowest in the city (the median community scores about 48). That single number blends several percentile-ranked components, and the blend is the interesting part:
- Crime volume: 5th percentile. On reported incidents alone, Beltline ranks among the highest-crime communities in Calgary. This is the figure most people mean when they call an area "sketchy," and on this measure the reputation has a basis.
- Street lighting: 22nd. Traffic safety: 14th. Noise: 0th. Dense, busy, and loud. Beltline records the worst noise score in the city.
- Police access: 87th. Fire access: 84th. Health access: 80th. This is the counterweight. When something goes wrong downtown, response infrastructure is close, and that lifts the composite well above the crime component alone.
So the "basically unsafe" version of Beltline you might hear at a dinner party fixates on crime volume, where Beltline genuinely ranks near the bottom of the city. The composite score of 31 lands higher than the crime reading because emergency access is strong, but as a citywide rank it still leaves Beltline low for overall safety. What the single number hides is the part that shapes daily life: which crimes, where, and which way they are trending.
There's also a structural pattern worth seeing before you judge Beltline in isolation. Calgary's most walkable neighbourhoods nearly all sit in the lower crime-safety percentiles, and its safest-on-crime neighbourhoods are mostly low-density suburbs. On crime volume alone, suburban Cranston sits in the 11th percentile (very little reported crime) while Beltline sits in the 90th. But Cranston's accessibility score is 16, against Beltline's 90. Weigh in emergency response and the rest of the safety picture, and the safety gap narrows sharply: Cranston scores 60, Beltline 31. That's a different trade-off, not a safer neighbourhood in every sense.
The question, then, isn't whether Beltline has more reported incidents than Tuscany. It does. The question is whether the type, trend, and distribution of those incidents fit your risk tolerance.
Crime by Category: What's Actually Being Reported
A neighbourhood with high theft-from-vehicle counts is a different lived experience than one with high assault rates. Beltline recorded 1,365 reported incidents in 2025 across the categories Calgary Police tracks, and two of them account for most of the volume.
Property crime makes up about 55% of the total. Theft from vehicles is the single largest category at 456 incidents (18.2 per 1,000), roughly four times the citywide rate of 4.3. It is also the fastest-growing: theft from vehicle jumped 39% in 2025 and was, on its own, the main reason Beltline's overall count rose that year. If you keep a car in Beltline, this is the risk the data points at most clearly, and it is the one most within your control through where and how you park.
Violent incidents make up about 45%. Assault is the second-largest category at 404 incidents (16.1 per 1,000), about five times the citywide rate of 3.2. That share is the real signal in Beltline's mix: citywide, the split runs closer to 65% property and 35% violent, so Beltline leans more toward violent categories than Calgary as a whole. Street robbery is less frequent at 2.5 per 1,000, but it roughly doubled between 2021 and 2024 before flattening in 2025.
Residential break-ins are the reassuring outlier. Break and enter of a dwelling sits at just the 53rd percentile citywide, essentially the Calgary median, at 1.1 per 1,000 against a citywide 0.9. For an inner-city core, that's unusually ordinary. Most of Beltline's elevated property crime is aimed at vehicles and commercial premises, not occupied homes, which matters if you're buying a unit to live in rather than parking a car on the street.
This is the moment to say plainly: scores are doors, not verdicts. A 5th-percentile crime reading tells you to look closer at which crimes and where, not to walk away.
Beltline vs. inner-city peers (per 1,000 residents, 2025)
| Community | Safety score | All crime | Theft from vehicle | Assault | Median assessed value |
|---|---|---|---|---|---|
| Beltline | 31 | 54.3 | 18.2 | 16.1 | $234,000 |
| Downtown East Village | 36 | 107.6 | 8.7 | 69.9 | $326,000 |
| Mission | 31 | 33.9 | 13.9 | 3.5 | $260,500 |
| Bridgeland/Riverside | 30 | 28.5 | 10.1 | 5.7 | $365,500 |
| Sunnyside (Kensington) | 57 | 20.4 | 7.6 | 3.3 | $375,500 |
| Inglewood | 39 | 24.4 | 6.0 | 3.0 | $388,500 |
| Calgary (citywide rate) | 48 (median) | 15.2 | 4.3 | 3.2 | n/a |
Reading across the row is more useful than the composite alone. Beltline and Mission both score 31 on composite safety, yet Mission's assault rate (3.5) is a fraction of Beltline's (16.1); Mission's burden is property crime, not violence. Downtown East Village scores higher than Beltline on the composite while reporting nearly double the overall crime rate and more than four times the assault rate. The composite score smooths over exactly these differences, which is why the category view matters.
The Trend: A Five-Year Decline, Then a 2025 Rebound
The trajectory is the most underweighted fact in any "is X safe" conversation, and it's also where the easy narrative about Beltline breaks down.
Beltline's reported crime did fall for several years. The rate dropped from 57.9 per 1,000 in 2021 to a low of 50.9 in 2024, a 12% decline. Then 2025 reversed part of that: incidents rose 6.8% to 54.3 per 1,000, driven almost entirely by the 39% surge in theft from vehicle. Assault actually fell 6.5% that same year.
The more sobering comparison is with the city as a whole. Calgary's reported crime fell faster and more steadily, down about 21% between 2023 and 2025 and essentially flat in 2025. So the claim that Beltline is "improving faster than Calgary" does not hold in the recent data. The opposite is closer to true: the citywide decline has outpaced Beltline's, and Beltline gave back some of its earlier gains in 2025.
What the trend supports is narrower and more useful than a clean "it's getting better" story:
- The single largest and fastest-growing risk in Beltline is property crime against vehicles, an insurable and largely behaviour-mitigable risk.
- Violent crime, though clearly elevated versus the city, was flat-to-down in 2025.
- The city-wide drop over 2022 to 2024 was real, and Beltline shared in it, even if 2025 ticked back up.
For Calgary's broader crime context across the same period, see our Alberta relocation guide.
Where in Beltline? The Block-Level View
Beltline isn't uniform. The block above a 17th Avenue bar has a different lived experience than a quiet stretch of 13th Avenue, even though they share one community score. Composite scores describe neighbourhoods; people live on blocks.
The data hints at where the difference concentrates. Beltline's noise score is the worst in the city (0th percentile), and that intensity tracks the 17th Avenue SW entertainment strip and the 11th Avenue corridor, where bars, restaurants, and late-night foot traffic cluster. A unit on a quieter residential block north of 14th Avenue sits in a measurably different micro-environment than one above a 17th Ave pub, even with an identical neighbourhood label.
The practical takeaway: if you're shortlisting Beltline condos, the address matters more than the neighbourhood name. Two units listed under the same community can sit in genuinely different settings, which is exactly what an address-level report is for.
The Full Picture: Beltline Across Four Lenses
Safety data alone doesn't tell you whether Beltline fits a first purchase. PickYourPlace's four lenses, Value, Safety, Accessibility, and Census, exist because neighbourhood fit is multidimensional.
Value. Beltline's median assessed value is $234,000 on the 2026 roll, up about 22% over five years but down 3% in the latest year. That's the most affordable entry point in the inner-city peer set: East Village runs around $326,000, Bridgeland $365,500, Inglewood $388,500, and the Kensington area $375,500 and up. Nearly the entire housing stock is condos, split almost evenly between one-bedroom (50%) and two-bedroom (47%) units, so this is an apartment market, not a detached-home one.
Safety. Composite score of 31 out of 100, among the lowest in the city, with the breakdown covered above: high reported crime (5th-percentile crime component), offset by strong police, fire, and health access (all above the 80th). Look at the category mix and the trend, not just the headline number.
Accessibility. Beltline scores 90 out of 100, with transit access at 98. Within a 15-minute walk of the neighbourhood centre, the data counts roughly 33 grocery and food destinations and 49 health and personal-care locations, plus direct CTrain access along the downtown corridor. Generate a full accessibility breakdown for any Beltline address to see exactly what's within your walking radius.
Census. Median age 34, average household size 1.6, and a median household income of about $49,100. Beltline is one of Calgary's most renter-heavy neighbourhoods, about 74% renter-occupied. For a buyer, high renter density can mean more building turnover, but it also signals strong rental demand if you ever need to lease your unit.
See It for a Specific Address
Neighbourhood data is one layer. Property-level data is another. A unit on 13th Avenue and a unit above a 17th Avenue bar will read very differently in an address-level report, even when their neighbourhood score is identical.
Generate a neighbourhood report for a specific Beltline address and the scores change, the walk radius changes, and the balance of the four lenses changes with it. That's where the decision actually gets made, on a block, not on a label. To weigh two or three specific units against each other, the Compare tool puts their lenses side by side.
What This Data Doesn't Capture
The data shows that Beltline reports more crime than most Calgary neighbourhoods, that property crime against vehicles dominates and is rising, that violent crime is elevated but was flat-to-down in 2025, and that the community offers some of the city's strongest walkability and emergency-service access at its most affordable inner-city price point.
Here is what the numbers leave out:
- Perceived safety: how safe you feel walking home at 11 PM on a Tuesday.
- Unreported incidents: a known gap in all crime statistics, especially for low-level theft, harassment, and vandalism.
- Time-of-day patterns: annual totals flatten the difference between a 3 PM block and a 2 AM block.
- Block-level variation: the data is community-level; lived experience is address-level.
- Denominator gaps: per-1,000 rates use residential population, but Beltline absorbs a large daytime and nightlife population that isn't in the denominator, which can make per-resident rates read higher than any one resident's actual exposure.
Numbers describe. They don't decide. If you prioritize walkability and central access, Beltline's trade-off may work for you, with vehicle theft as the risk to plan around. If a high reported-crime count is a dealbreaker regardless of context, the same data points you toward walkable but lower-crime alternatives: Sunnyside in the Kensington area (safety score 57, 20.4 incidents per 1,000) or Mission (similar walkability to Beltline with a far lower assault rate), both at a modestly higher price.
Methodology and Sources
- Crime data: Calgary Police Service community-level incident statistics, pulled live from the PickYourPlace database, with 2025 as the most recent complete year and trends drawn from 2021 to 2025.
- Safety, accessibility, and value scores: PickYourPlace 0-to-100 lens scores across all Calgary communities, each blended from percentile-ranked components. The safety composite blends reported crime, traffic, street lighting, noise, and proximity to police, fire, and health services.
- Population and demographics: Statistics Canada, 2021 Census, aggregated to community polygons.
- Property values: City of Calgary 2026 assessment roll, aggregated by community.
- Citywide rates are population-weighted across all Calgary communities for the stated year.
- Crime Severity Index context: Statistics Canada, Juristat.
See the PickYourPlace data catalogue for full coverage and update cadence.
Explore Beltline Yourself
The best way to judge whether Beltline is safe for your situation is to look at the data directly:
- Open the Safety lens on the Explore map to toggle crime categories, street lighting, and traffic safety, and compare Beltline against any other Calgary community.
- Read the Beltline neighbourhood guide for the full lens-by-lens breakdown.
- See how we track crime, lighting, and traffic safety across Calgary and Vancouver.
- Compare the safest neighbourhoods in Calgary if a low incident count is your top priority.
Find your neighbourhood match in 60 seconds.
Answer six questions and the data suggests a Canadian neighbourhood that fits your priorities and budget. Public, shareable, no signup.
Keep reading

Is Highland Park Calgary Safe? Reading the Inner-North Crime Data
Is Highland Park Calgary safe? We pulled the Calgary Police crime data for this inner-north community and read a safety score of 49 category by category.

Is Oakwood Village Toronto Safe? What the Crime Data Shows
Is Oakwood Village Toronto safe? We read the Toronto Police crime data by category and trend to show how to turn a safety score into a question you can act on.
Is Pelmo Park-Humberlea Safe? How to Read Northwest Toronto's Crime Data Before You Buy
Is Pelmo Park-Humberlea safe? We read Toronto's 2025 crime data by category and trend to show how to weigh a northwest Toronto safety score before you buy.
Check a neighbourhood
Every neighbourhood has a page with its safety rank, what that rank measures and what it cannot tell you. Free, and no account.
Check a neighbourhood