Calgary Real Estate Agent Neighbourhood Data Tools for 2026
Your client lands in Calgary on Friday. They're flying in from Toronto, they've never set foot in Brentwood, and you have four showings lined up by noon. They'll ask about safety. They'll ask about schools. They'll want to know how the assessed values compare to the city average. You'll have about 90 seconds between the car and the front door to sound like you know the neighbourhood cold.
Most Calgary buyers' agents handle this with a paragraph or two in an email, maybe a few MLS stats, maybe a quick note about the nearest C-Train station. It works, but it doesn't build confidence for a client making a $650,000 decision from 3,400 km away.
A neighbourhood briefing does.
What a Pre-Showing Neighbourhood Brief Should Cover
Out-of-province buyers don't need a sales pitch. They need orientation. A good briefing answers the questions your client is already Googling at 11 p.m. the night before their flight, and packages those answers into something they can skim in five minutes.
Here's what belongs in a briefing for a Calgary showing:
Property context. The assessed value of the target property, how it compares to the community average, and the year-over-year trend. In Brentwood, for example, median assessed values sit around $684,000, above the Calgary-wide median of $585,000. A client from Toronto, where comparable properties run north of $1.2 million, needs that anchor point immediately.
Safety data. Not a vague "it's a safe area", actual numbers. Brentwood's crime rate sits at approximately 17.2 incidents per 1,000 residents, above Calgary's city-wide average of 13.0, reflecting its proximity to the university and commercial corridors. Street lighting density, emergency response proximity, and year-over-year crime trends round out the picture. Based on three years of Calgary Police data, Brentwood ranks in roughly the 43rd percentile for safety. That doesn't capture unreported incidents, but it gives your client a clear relative benchmark.
Accessibility. How far is the nearest grocery store, school, or park? For Brentwood: 4 grocery stores within a 15-minute walk, Brentwood LRT station under 800 m from most addresses, and 6 parks within 1.5 km. Transit score sits above the 70th percentile city-wide, a number that matters to out-of-province buyers who may not have a second vehicle right away.
Census snapshot. Household composition, median income, and tenure mix help your client understand who lives there. Brentwood's homeownership rate hovers around 55%, with a median household income near $42,000. The age distribution skews toward established families and retirees, useful context for a young couple wondering whether they'll find peers in the community.
Leave out: school rankings (too subjective and change annually), future development speculation, and anything you can't source.
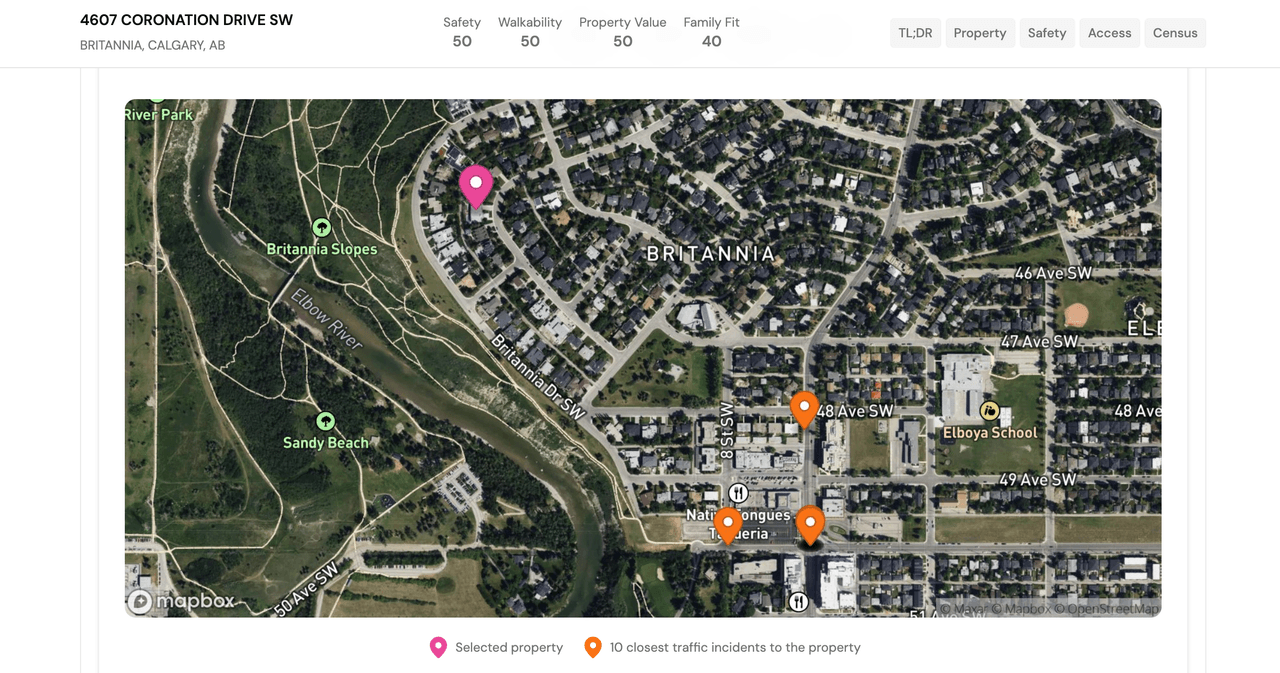
What Your Client Sees in a PickYourPlace Report
The neighbourhood data tools available to Calgary agents have improved significantly in 2026. Instead of assembling a briefing from four different sources (city crime maps, assessment rolls, census tables, Google Maps), you can pull a single report from PickYourPlace's Analyze module that covers all four lenses in one document.
Here's what a report includes:
- Value lens: Assessed value, year-over-year change, comparison to community and city averages
- Safety lens: Crime incidents by category, street lighting density, emergency service proximity, percentile ranking
- Accessibility lens: Walking, cycling, and transit distances to grocery, schools, parks, healthcare, recreation
- Census lens: Population density, age distribution, household income, housing tenure
Each section includes a percentile score, relative to all other Calgary neighbourhoods, so your client can quickly gauge where a community stands. The AI-generated narrative summarizes trade-offs in plain language: "If you prioritize transit access, Brentwood outperforms Bowness. If lot size matters more, Bowness offers 40% larger parcels on average."
For a deeper look at how the report tiers work, see how Analyze turns raw data into structured reports.
The Shareable Link: Pre-Showing Prep in a Single URL
Every report generated on PickYourPlace has a public, shareable URL. That's the part that changes the workflow.
Instead of copying data points into an email, you generate a report, copy the link, and drop it into your pre-showing message. Your client reads it on the plane. They arrive with context, not questions that eat into showing time.
The workflow takes about five minutes:
- Enter the listing address on PickYourPlace Explore to check the map layers
- Generate an In-Depth or Complete report via Analyze
- Copy the shareable report URL
- Paste it into your client prep email alongside the MLS sheet
For agents comparing multiple properties in the same neighbourhood, the Compare module puts two or three reports side-by-side with a neutral AI-written analysis of the trade-offs. That's especially useful when your client has a shortlist but hasn't visited yet.
If you want reports tailored to a specific buyer profile, say, a family with school-age children versus a downsizing retiree, personalized reports weight the analysis toward what that profile cares about most.
How This Workflow Fits the Calgary Spring Market
Calgary's spring 2026 market is seeing strong out-of-province demand. Alberta gained over 6,100 net interprovincial migrants in Q2 2025 alone, and Calgary remains the primary destination. Many of these buyers are working with a local agent remotely before flying in for a concentrated weekend of showings. (Read the full Ontario-to-Alberta relocation picture.)
For agents serving this segment, the challenge isn't finding listings, it's compressing weeks of neighbourhood research into a few days. A briefing backed by actual data (assessed values, crime percentiles, accessibility scores) does two things: it reduces the number of "tell me about the area" conversations that stall a showing, and it builds your credibility as an agent who works with real numbers.
Calgary real estate agent neighbourhood data tools like PickYourPlace are built for exactly this use case. The data comes from open government sources, City of Calgary property assessments, Calgary Police crime reports, Statistics Canada census profiles, and OpenStreetMap points of interest. It's the same data you could assemble manually; the difference is that it's already aggregated, scored, and formatted for a client-facing audience.
Try It Before Your Next Showing
The Pro Agent plan includes 50 reports per month, 1,000 chat messages per month, and full access to Compare, built for agents who generate multiple reports per week. The 7-day free trial requires only an email address, no credit card.
Generate a report for your next listing address. Share the link with your client. See whether it changes the conversation at the door.
Explore Calgary neighbourhoods on PickYourPlace →Generate a neighbourhood report →
Find your neighbourhood match in 60 seconds.
Answer 6 questions, the data suggests a Canadian neighbourhood that fits your priorities and budget. Public, shareable, no signup.