Census profile in Chameran/Montpellier, Montréal
Chameran/Montpellier scores 37 out of 100 on the census composite, the 0th percentile of Montréal (city median 49).
Census score
A composite of household income, employment, equality, density, and dwelling values from the 2021 Canadian census. Each input is percentile-ranked across Montréal, then weighted into the composite above.
What stands out
See the full census report
All five census sub-scores, the underlying StatCan dissemination-area data, and an AI-written briefing for Chameran/Montpellier, included in a Decision Pass: $129 once, valid 90 days, for one home search.
Go deeperSimilar neighbourhoods
Compares nine equally weighted assessment and Access metrics ranked within each city. Rental yield, Safety, Climate and Census do not affect this comparison. It does not compare prices, travel times or overall suitability.
Reference (YUL): 2026-10-01; population coverage is at least 90% per metric. Candidate (YUL): 2026-10-01; population coverage is at least 100% per metric.
Reference (YUL): 2026-10-01; population coverage is at least 90% per metric. Candidate (YUL): 2026-10-01; population coverage is at least 100% per metric.
Reference (YUL): 2026-10-01; population coverage is at least 90% per metric. Candidate (YUL): 2026-10-01; population coverage is at least 100% per metric.
Reference (YUL): 2026-10-01; population coverage is at least 90% per metric. Candidate (YUL): 2026-10-01; population coverage is at least 100% per metric.
Reference (YUL): 2026-10-01; population coverage is at least 90% per metric. Candidate (YUL): 2026-10-01; population coverage is at least 100% per metric.
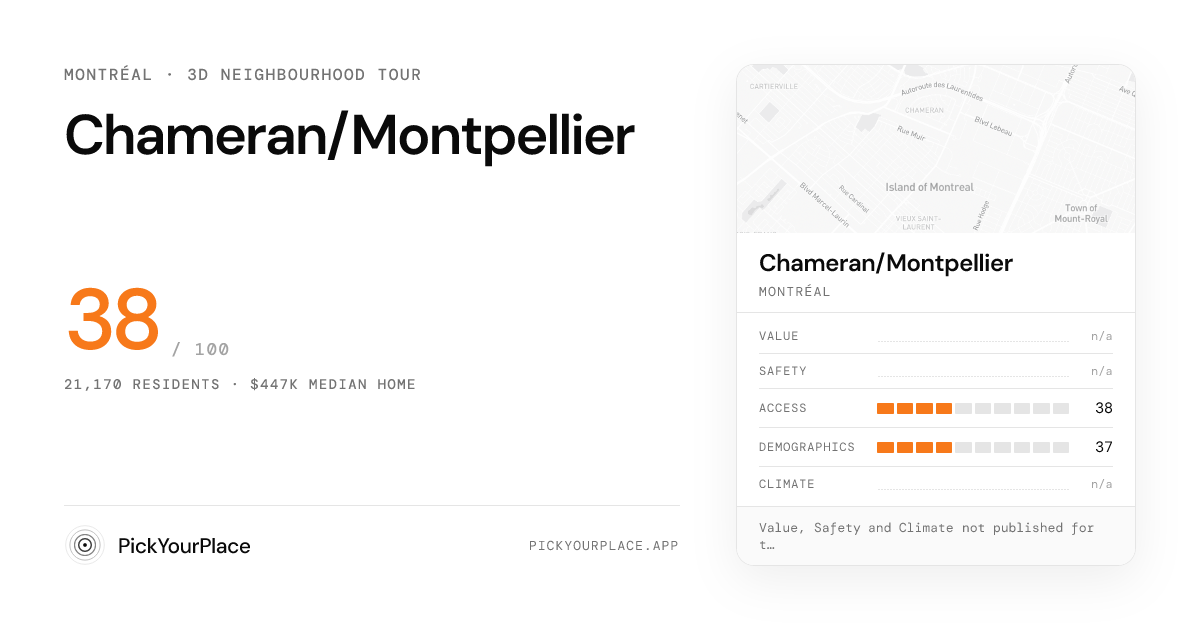
A 60-second cinematic flythrough of the places that shape daily life here. No account needed.
Start the tourTake the 60-second match quiz, answer 6 questions and the data suggests a Montréal neighbourhood that fits your priorities and budget.