Overview · Montréal, QC

Maisonneuve, Montréal

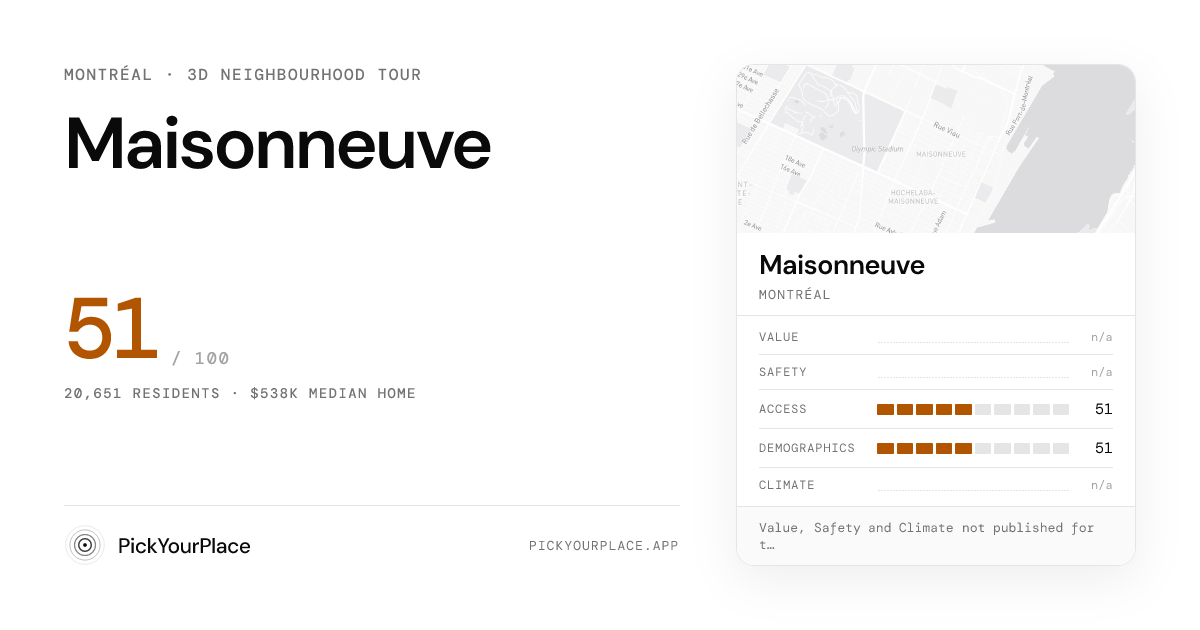
Qualified assessment, Access, Safety and Climate evidence, with Census as context. 34 dissemination areas. Population approximately 20,651.

At a glance

Tap any lens to jump to its data. Each is a 0 to 100 score versus other Montréal neighbourhoods.

Notable in this neighbourhood
Safety needs a closer look here. Safety scores 32/100, the bottom quintile of Montréal.
Low mapped climate risk. Climate scores 58/100, the second quintile of Montréal.
An affordable corner of Montréal. Property Value scores 50/100, the middle band of Montréal.

Safety

Fire access
68
Lighting
63
Police access
58
Quiet
46
Health access
35
Traffic
15
Low crime
5

Maisonneuve scores 32/100 on safety, the 5th percentile of Montréal neighbourhoods (city median 48). Its strongest signal is fire-service access.

Ask: "How does Maisonneuve's safety compare to the rest of Montréal?"

Property Value

Renovation
73
Rental
64
Development
46
Median value
40
Growth
40

Maisonneuve scores 50/100 on property value, the 48th percentile of Montréal neighbourhoods (city median 50). Its strongest signal is renovation activity.

Ask: "What's the price trend for homes in Maisonneuve?"

Climate

Mapped climate risk index: 45/100

Maisonneuve scores 58/100 on climate, the 64th percentile of Montréal neighbourhoods (city median 57).

Ask: "What's the climate risk for a specific address in Maisonneuve?"

Census

Employment
71
Commute
67
Income
59
Density
54
Equality
50
Dwelling value
18
Culture
10

Maisonneuve scores 51/100 on census, the 60th percentile of Montréal neighbourhoods (city median 49). Its strongest signal is employment.

Ask: "Who lives in Maisonneuve?"

Accessibility

Grocery
69
Retail
69
Trails
62
Dining
54
Recreation
47
Health
45
Transit
35
Schools
29

Maisonneuve scores 50/100 on accessibility, the 48th percentile of Montréal neighbourhoods (city median 51). Its strongest signal is retail access.

Ask: "What's the commute from Maisonneuve to downtown Montréal?"

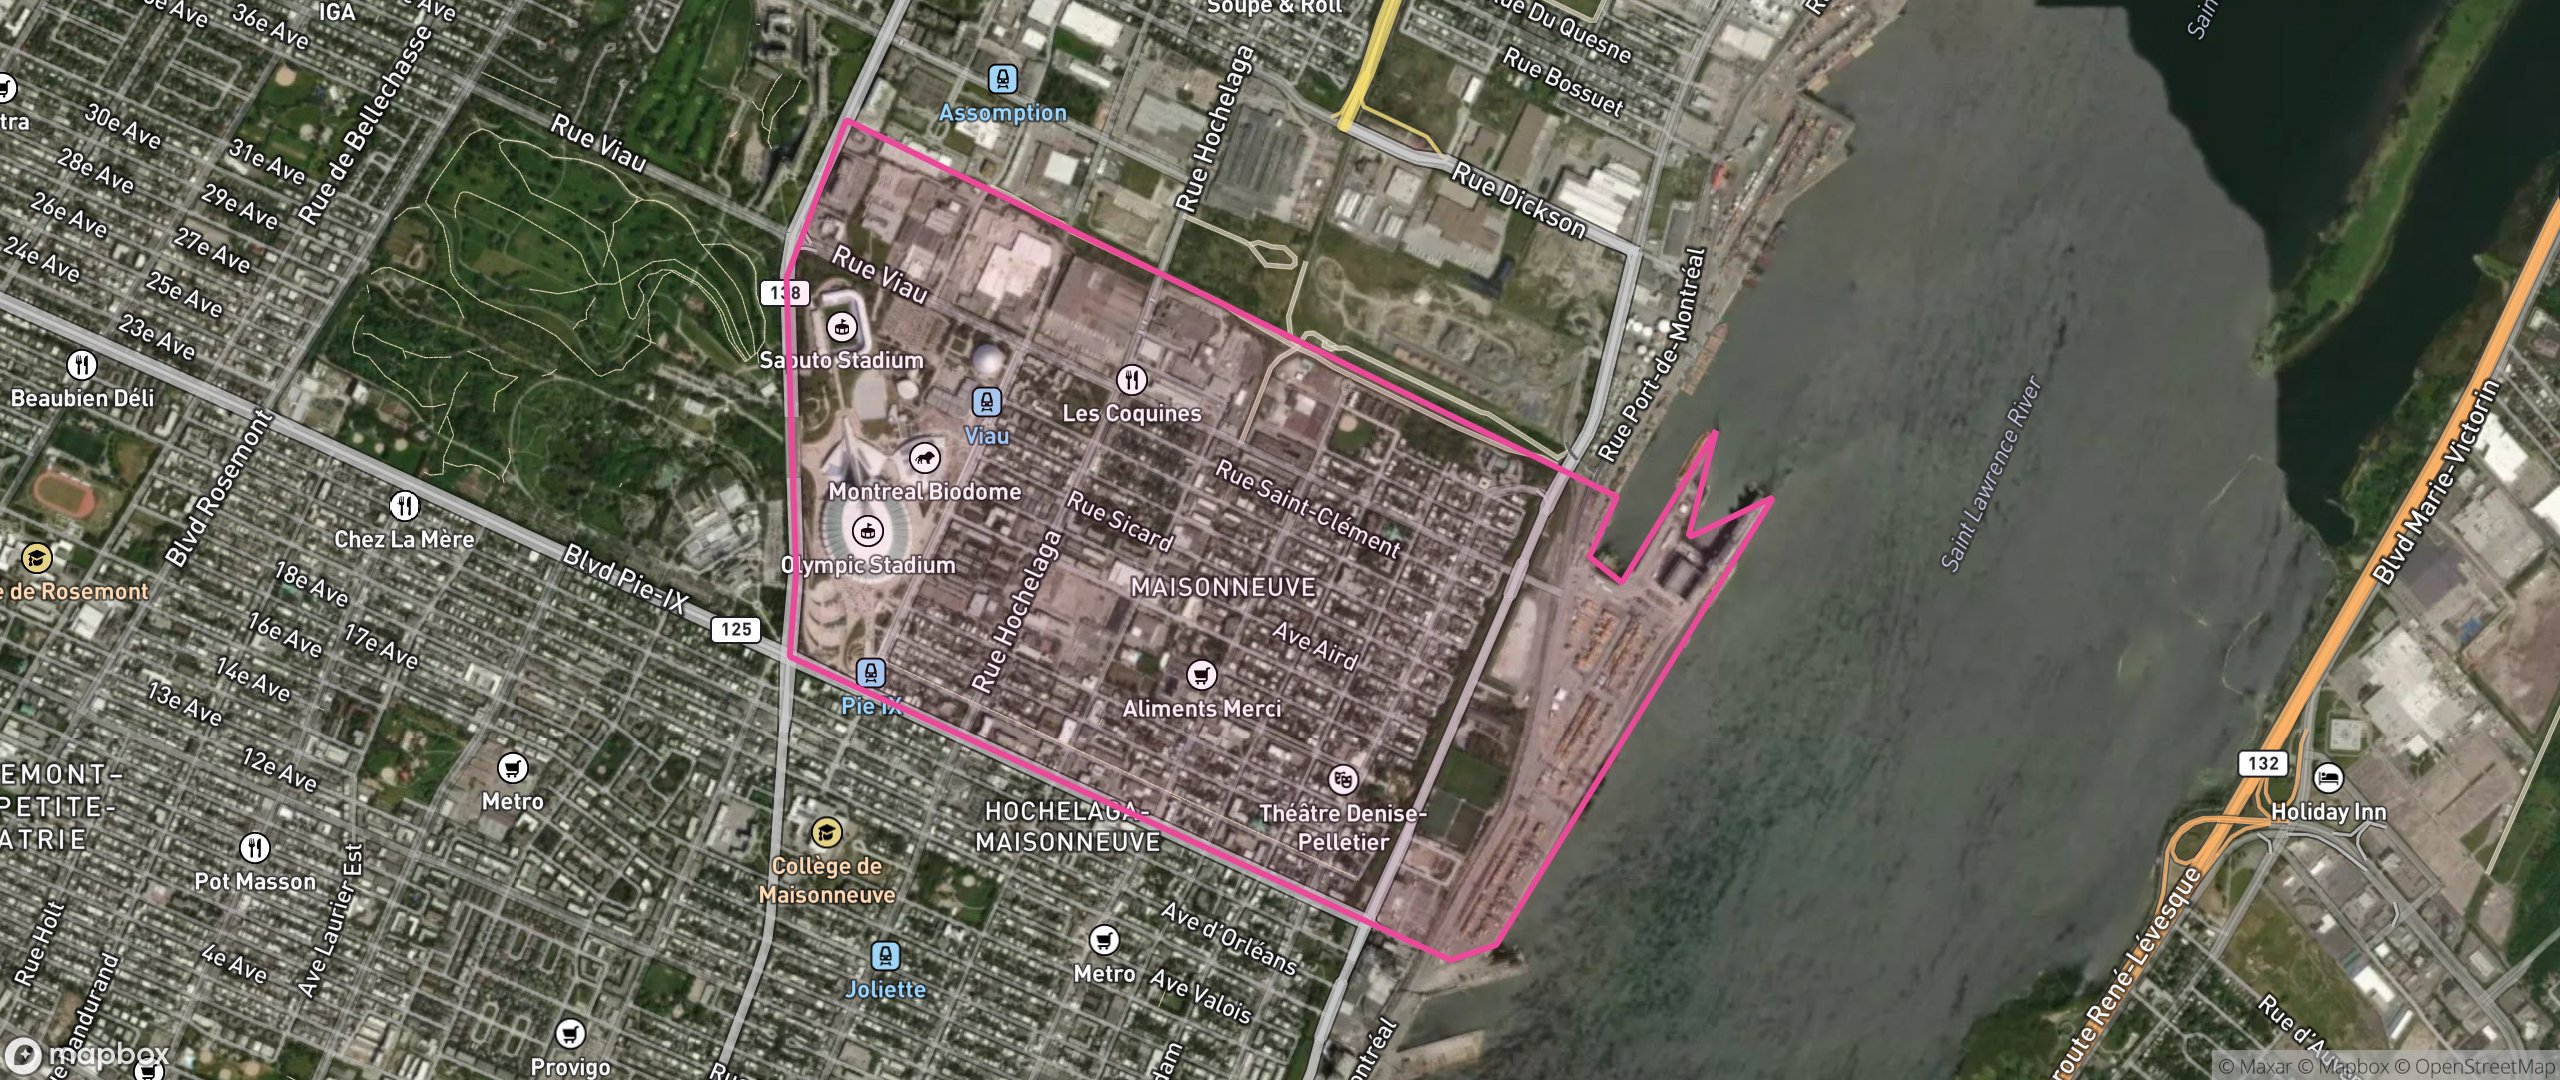
Map

Map of Maisonneuve, Montréal showing the community boundary

Frequently asked

What do Maisonneuve's scores show?
Value scores 50/100, Access 50/100, Safety 32/100 and Climate 58/100 in Montréal. The decision score uses these supported lenses. Access describes mapped facility proximity, not travel times, service frequency, school quality or attendance zones. No lens is unavailable. Census is context only.
What property value evidence is available?
Value combines the median assessed value, new-build and renovation permit counts, an annualised growth estimate from the previous triennial roll, and a rental-yield estimate from CMHC zone rents, each where its evidence is observed. Growth and rental yield are estimates, not year-over-year change or landlord income. Assessed values are not sale prices.
How are these scores calculated?
Qualified sub-components are percentile-ranked and combined using the published weights. City percentiles are shown separately from composite scores. Access describes mapped facility proximity, not travel times, service frequency, school quality or attendance zones. No lens is unavailable. Census is context only.

Nearby neighbourhoods

Maisonneuve 3D tour preview
Neighbourhood tour
Fly through Maisonneuve in 3D

A 60-second cinematic flythrough of the places that shape daily life here. No account needed.

Start the tour
Updated
October 6, 2026
Coverage
Montréal: 77+ neighbourhoods scored
Not sure Maisonneuve is the right fit?

Take the 60-second match quiz, answer 6 questions and the data suggests a Montréal neighbourhood that fits your priorities and budget.