Chutes-Montmorency, Québec City
Qualified assessment, Access and Climate evidence, with Census as context. 28 dissemination areas. Population approximately 16,273.
At a glance
Tap any lens to jump to its data. Each is a 0 to 100 score versus other Québec City neighbourhoods.
Safety
Safety scores cannot be established from the current qualified evidence.
Ask: "How does Chutes-Montmorency's safety compare to the rest of Québec City?"Property Value
Chutes-Montmorency scores 46/100 on property value, the 46th percentile of Québec City neighbourhoods (city median 46). Its strongest signal is rental supply.
Ask: "What's the price trend for homes in Chutes-Montmorency?"Accessibility
Chutes-Montmorency scores 26/100 on accessibility, the 17th percentile of Québec City neighbourhoods (city median 46).
Ask: "What's the commute from Chutes-Montmorency to downtown Québec City?"Climate
Chutes-Montmorency scores 60/100 on climate, the 17th percentile of Québec City neighbourhoods (city median 64).
Ask: "What's the climate risk for a specific address in Chutes-Montmorency?"Census
Chutes-Montmorency scores 42/100 on census, the 6th percentile of Québec City neighbourhoods (city median 50). Its strongest signal is population density.
Ask: "Who lives in Chutes-Montmorency?"Map
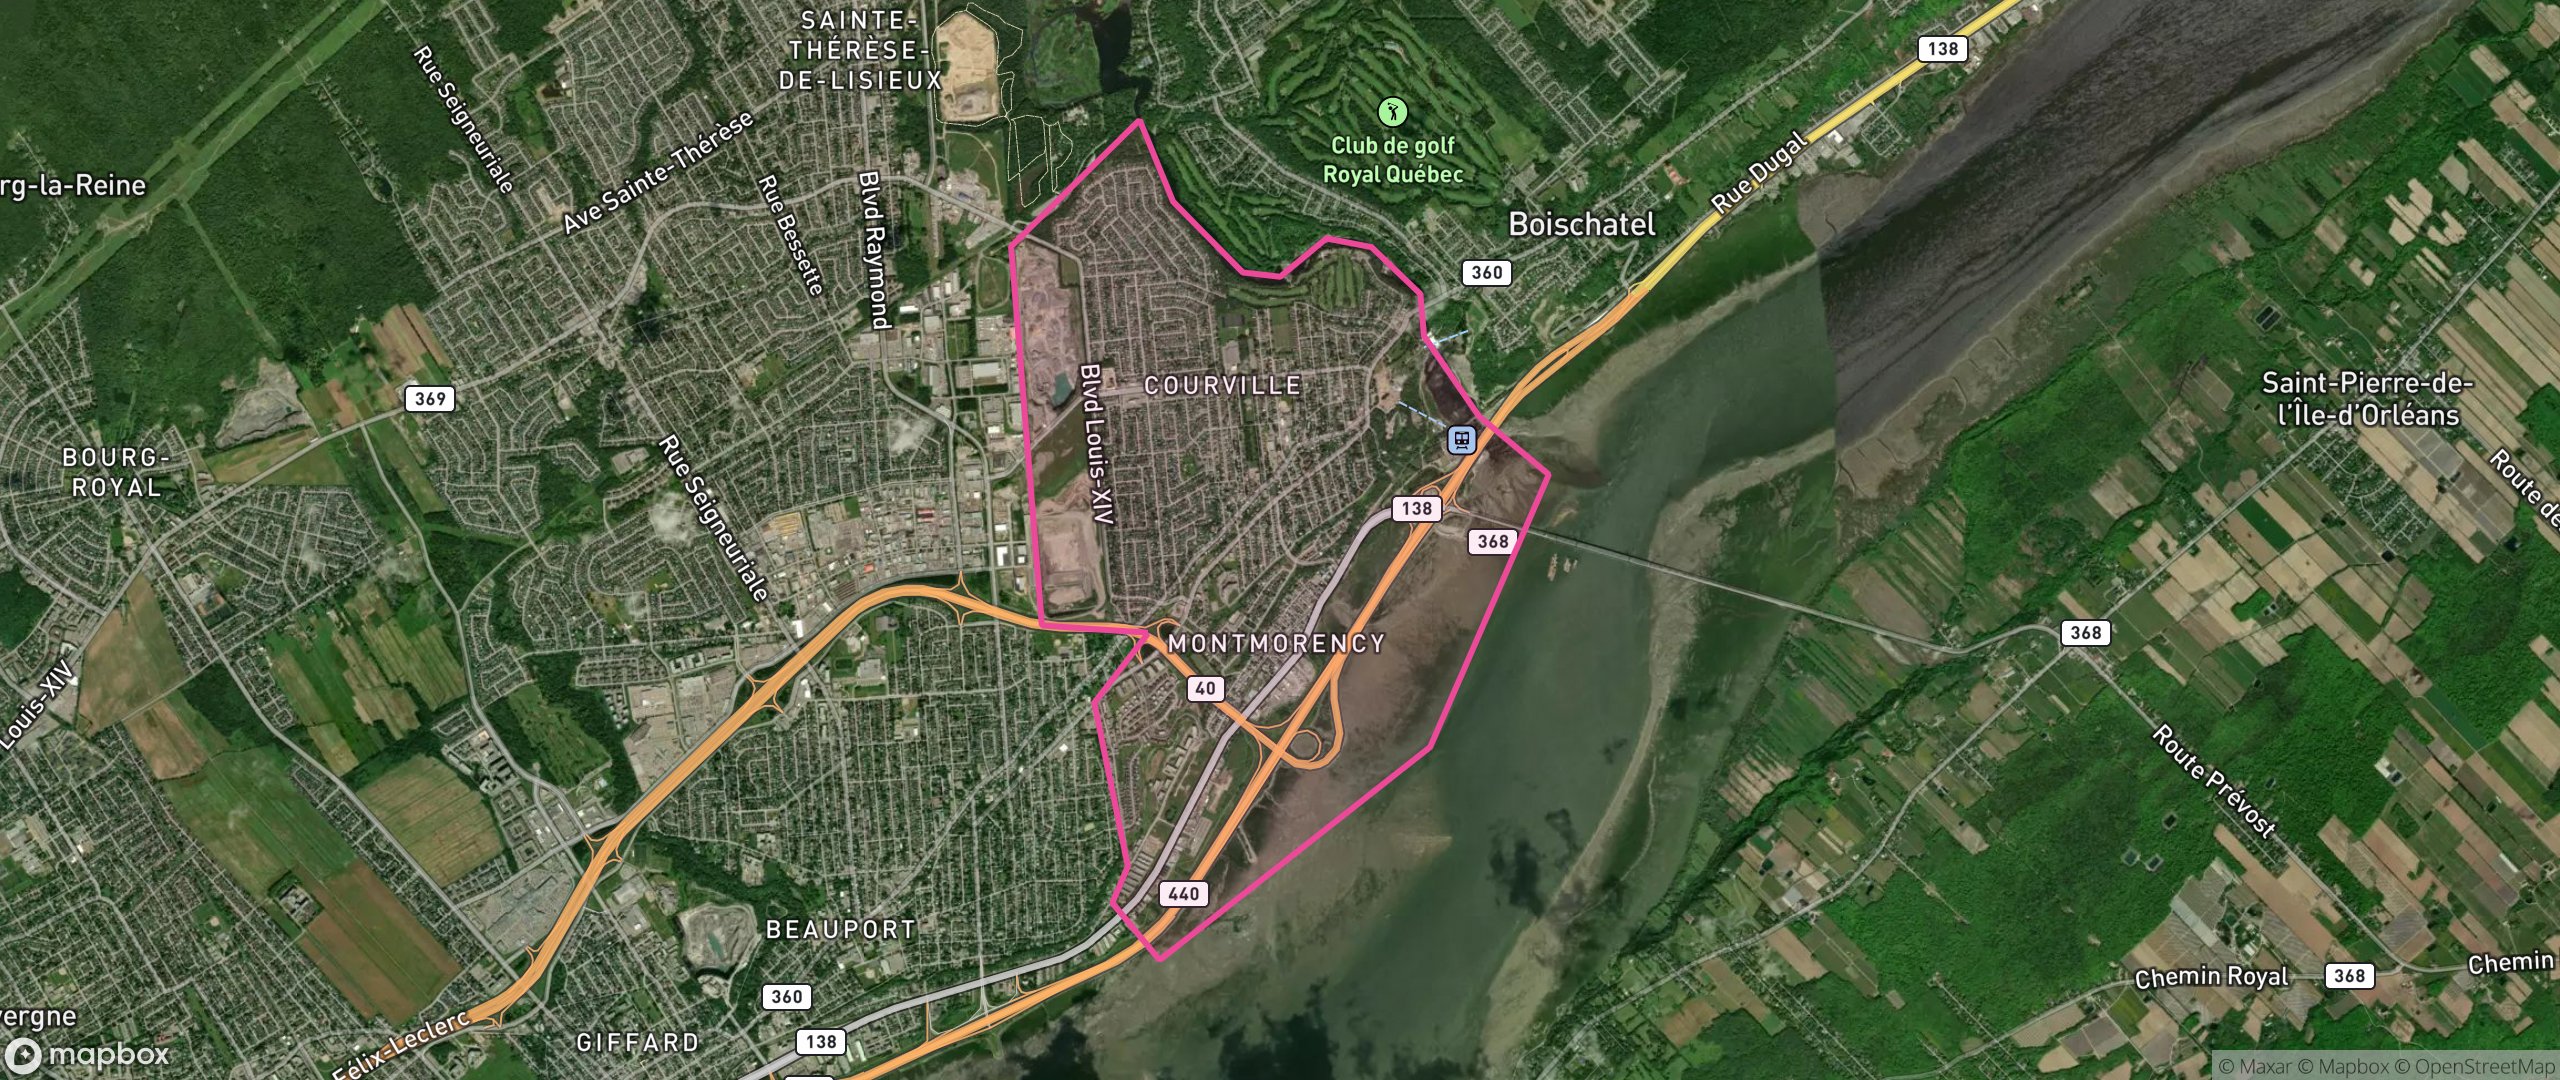
Frequently asked
What do Chutes-Montmorency's scores show?
What property value evidence is available?
How are these scores calculated?
Nearby neighbourhoods
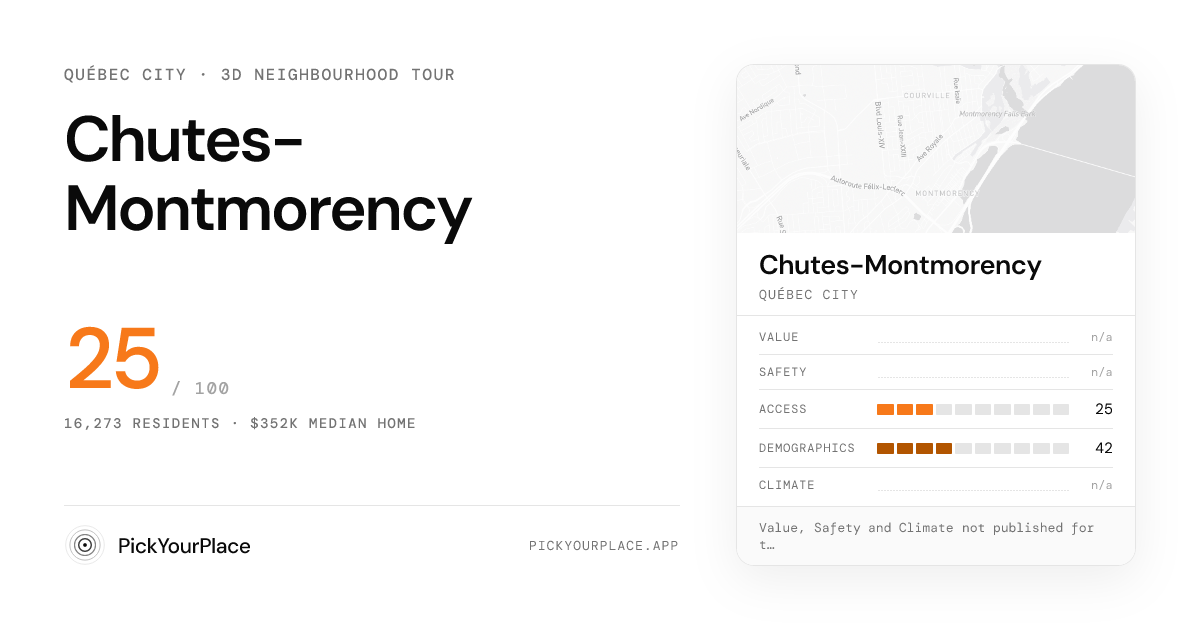
A 60-second cinematic flythrough of the places that shape daily life here. No account needed.
Start the tourTake the 60-second match quiz, answer 6 questions and the data suggests a Québec City neighbourhood that fits your priorities and budget.