Is Highland Park Calgary Safe? Reading the Inner-North Crime Data
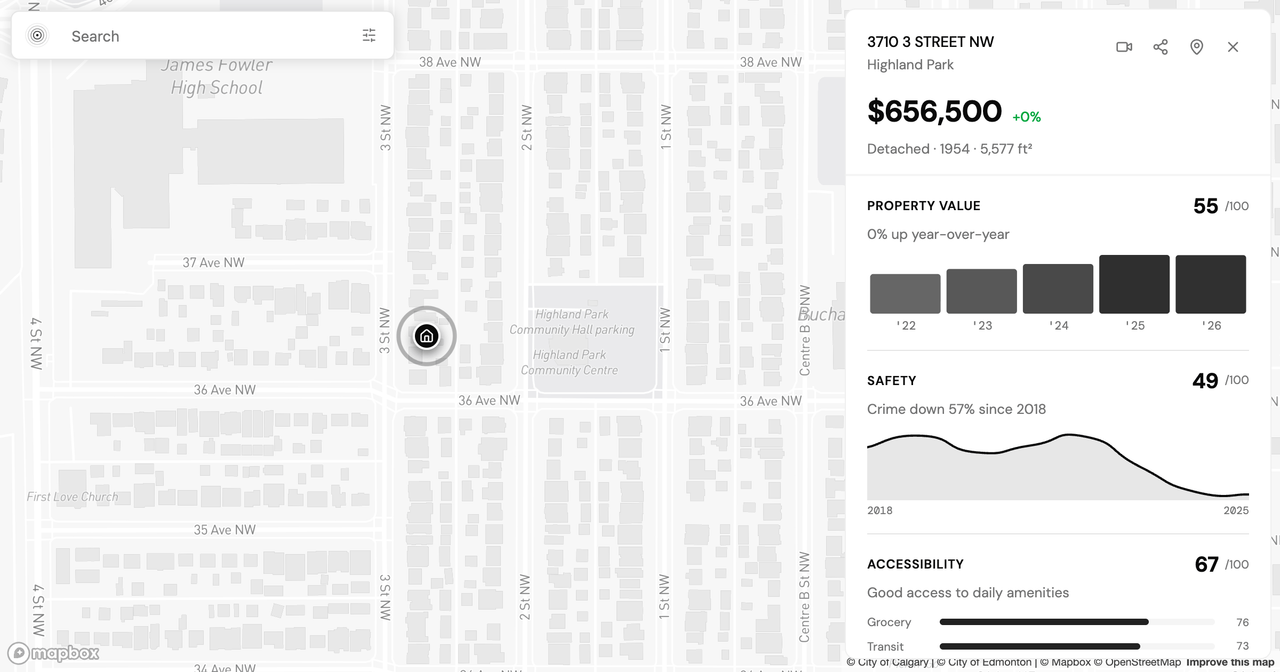
Data freshness: Calgary Police Service and City of Calgary open data, pulled live from the PickYourPlace database on 31 August 2026, with 2025 as the most recent complete year. Property values from the City of Calgary 2026 assessment roll. Population and demographics from Statistics Canada. See the closing section for what these numbers do and do not cover.
You have found a house in Highland Park. It is a bungalow on a quiet street north of the river, the price is workable, and the drive downtown is short. Then you type the question everyone types before an offer: is Highland Park Calgary safe?
The honest answer starts with a number that refuses to settle the argument. Highland Park's safety score is 49 out of 100, almost exactly the Calgary median score of about 48. A middle score is the hardest kind to act on, because it neither waves you off nor waves you through. So here is what actually sits underneath it.
Highland Park by the Numbers
Calgary Police Service publishes community-level incident counts every year, and the Safety lens for Highland Park turns those counts, along with the rest of the safety inputs, into a single 0-to-100 score. For 2025, four figures frame the neighbourhood:
| Measure (2025) | Highland Park |
|---|---|
| Composite safety score | 49 / 100 (near the city median of about 48) |
| Reported incidents | 77 (20.1 per 1,000 residents) |
| Crime-volume rank | 66th percentile citywide (higher = more volume than most) |
| All-crime trend | Down 7.3% year over year |
Read together, those pull in two directions. The volume rank sits above the city's middle: Highland Park reports more incidents than roughly two-thirds of Calgary neighbourhoods. The trend runs the other way, with total reported crime down 7.3% over the year. The composite lands at the midpoint because the safety score blends more than raw counts.
A Safety Score of 49 Is a Door, Not a Dismissal
A middle score is not a quiet verdict. It is an instruction to look closer. What drives Highland Park's number is not one alarming category but a spread of ordinary property and violent incidents at moderate rates. The score cannot tell you which of those weighs most for you. That depends on whether you park on the street, how you read a rising line on a small base, and what you weigh the safety number against. The categories are where the decision actually lives.
The Category Breakdown
Three categories carry most of Highland Park's 2025 volume, and they point in different directions:
- Assault: 21 incidents (5.5 per 1,000), up 61.4% year over year.
- Theft from vehicle: 18 incidents (4.7 per 1,000), up 12.5%.
- Theft of vehicle: 12 incidents (3.1 per 1,000), down 24.9%.
The lived experience of these differs. Vehicle crime is property crime you can partly plan around through where and how you park, and the two categories split: break-ins edged up while stolen vehicles fell by roughly a quarter. Assault is the category people mean when they ask whether an area is safe, and it is the one moving fastest here. Which brings up the number that will catch every reader's eye.
The 61% Jump, Read Carefully
A 61.4% year-over-year rise in assault sounds like an emergency. The underlying counts are 13 incidents in the prior year and 21 in 2025, a difference of eight. On a base that small, a handful of incidents swings the percentage hard in either direction, and a single quiet year would swing it back just as sharply. That does not make the increase meaningless: eight more assaults is eight more, and the direction is worth watching against next year's data. But a percentage change on a small base is a prompt to check several years of the trend, not a headline to react to on its own. The all-crime line for the same neighbourhood fell 7.3% over the same period, which is the tension a single category cannot resolve.
Value and Demand: 41.6% Over Five Years, Then Flat
Safety is one lens of five, and the others change how the number reads. Highland Park's median assessed value on the 2026 roll is $656,500, up 41.6% over five years and flat (0.0%) in the latest year. A five-year climb of that size, then a pause, describes an established inner-north neighbourhood that has already been bid up rather than one still being discovered. The full Highland Park breakdown puts its value score at 55 out of 100.
Reading Safety Alongside the Rest of the Data
This is where the decision-support framing matters more than any single score. If you prioritize getting around without a car, Highland Park reads well: accessibility scores 67 out of 100 and transit sits in the 73rd percentile, with five grocery and food destinations inside a 15-minute walk of the neighbourhood centre. If a low reported-crime volume is your top filter, the 66th-percentile crime rank is the figure to weigh against that access, alongside the assault trend. The census fills in who lives there: a median age of 39, an average household of 2.1 people, and a tenure split of about 63% renter to 38% owner, which points to steady rental demand if you ever lease the place out. Set those lenses beside other Calgary neighbourhoods and the trade-off, not a ranking, is what you are choosing between.
What the Numbers Don't Capture
The data shows Highland Park reporting a little above the city's middle for crime volume, with a falling overall trend, a fast-rising but small assault count, and vehicle crime split between rising break-ins and falling theft of vehicles. Here is what it leaves out: how safe you feel walking home at night, unreported incidents (a known gap in all crime statistics), the time-of-day and block-level patterns that annual community totals flatten, and the daytime population that per-resident rates do not count. Numbers describe. They do not decide.
Sources: Calgary Police Service (2025), City of Calgary open data, the municipal 2026 assessment roll, and Statistics Canada.
See It for a Specific Address
Community figures describe a neighbourhood. A specific address reads differently, and that is where the offer actually gets made. Generate a report for a Highland Park address to see how the five lenses land for the exact block you are considering, or start with a free 7-day trial on the plans page.
Keep reading

Is Oakwood Village Toronto Safe? What the Crime Data Shows
Is Oakwood Village Toronto safe? We read the Toronto Police crime data by category and trend to show how to turn a safety score into a question you can act on.
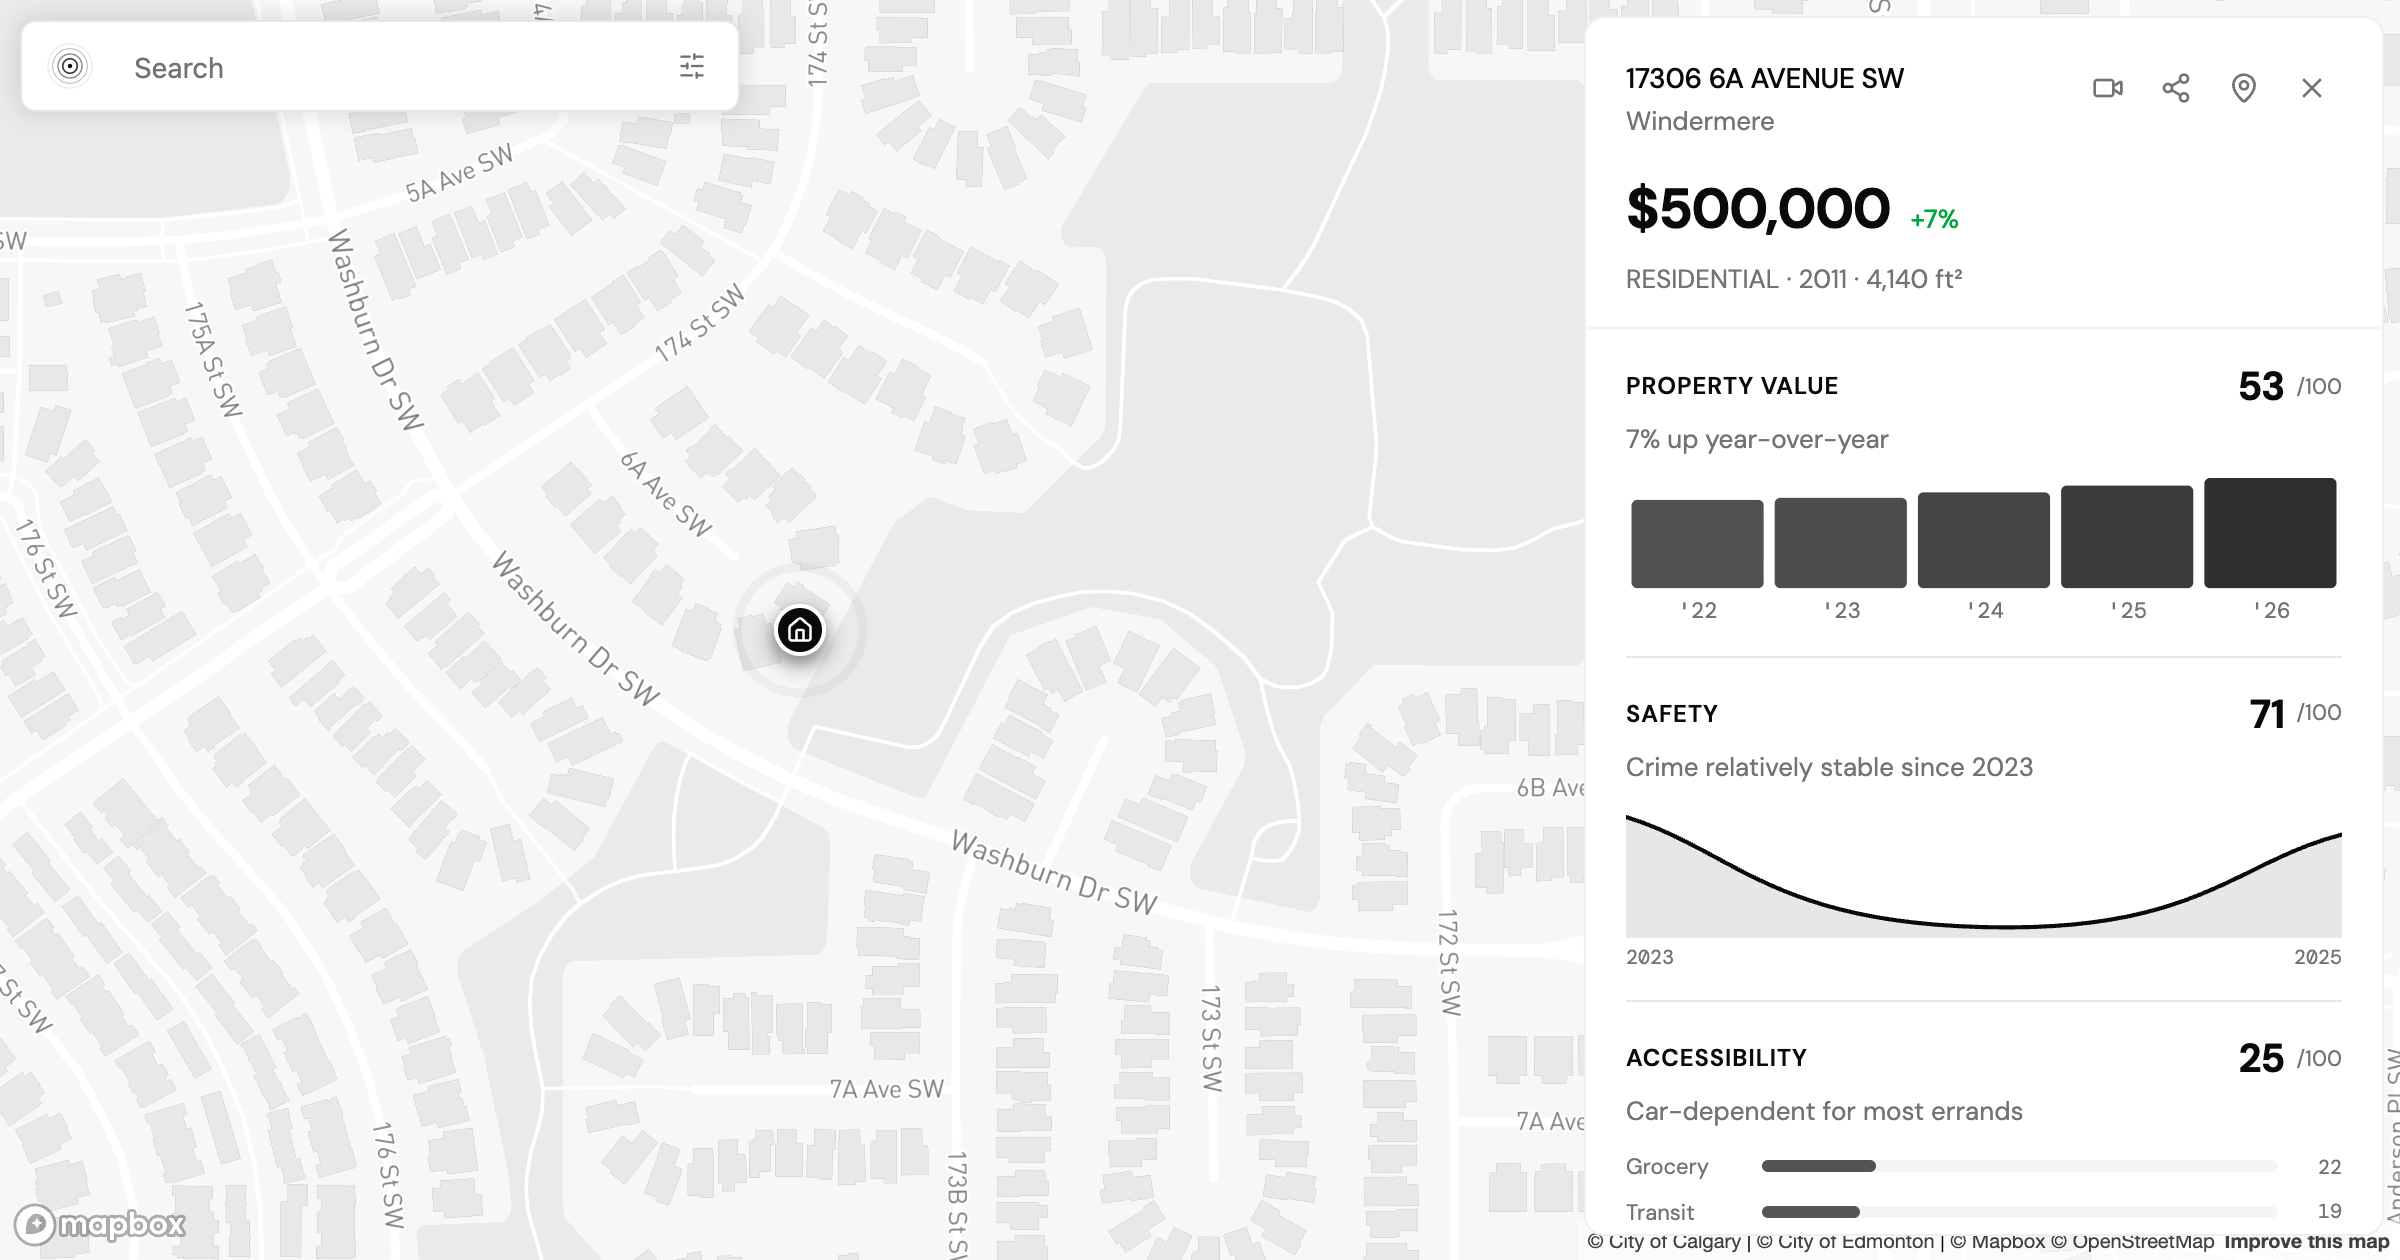
Allendale vs Windermere: Two Edmonton Neighbourhoods, Side by Side
Allendale vs Windermere in Edmonton: two communities at nearly the same assessed value that split on transit, safety, and who lives there. What the data shows.
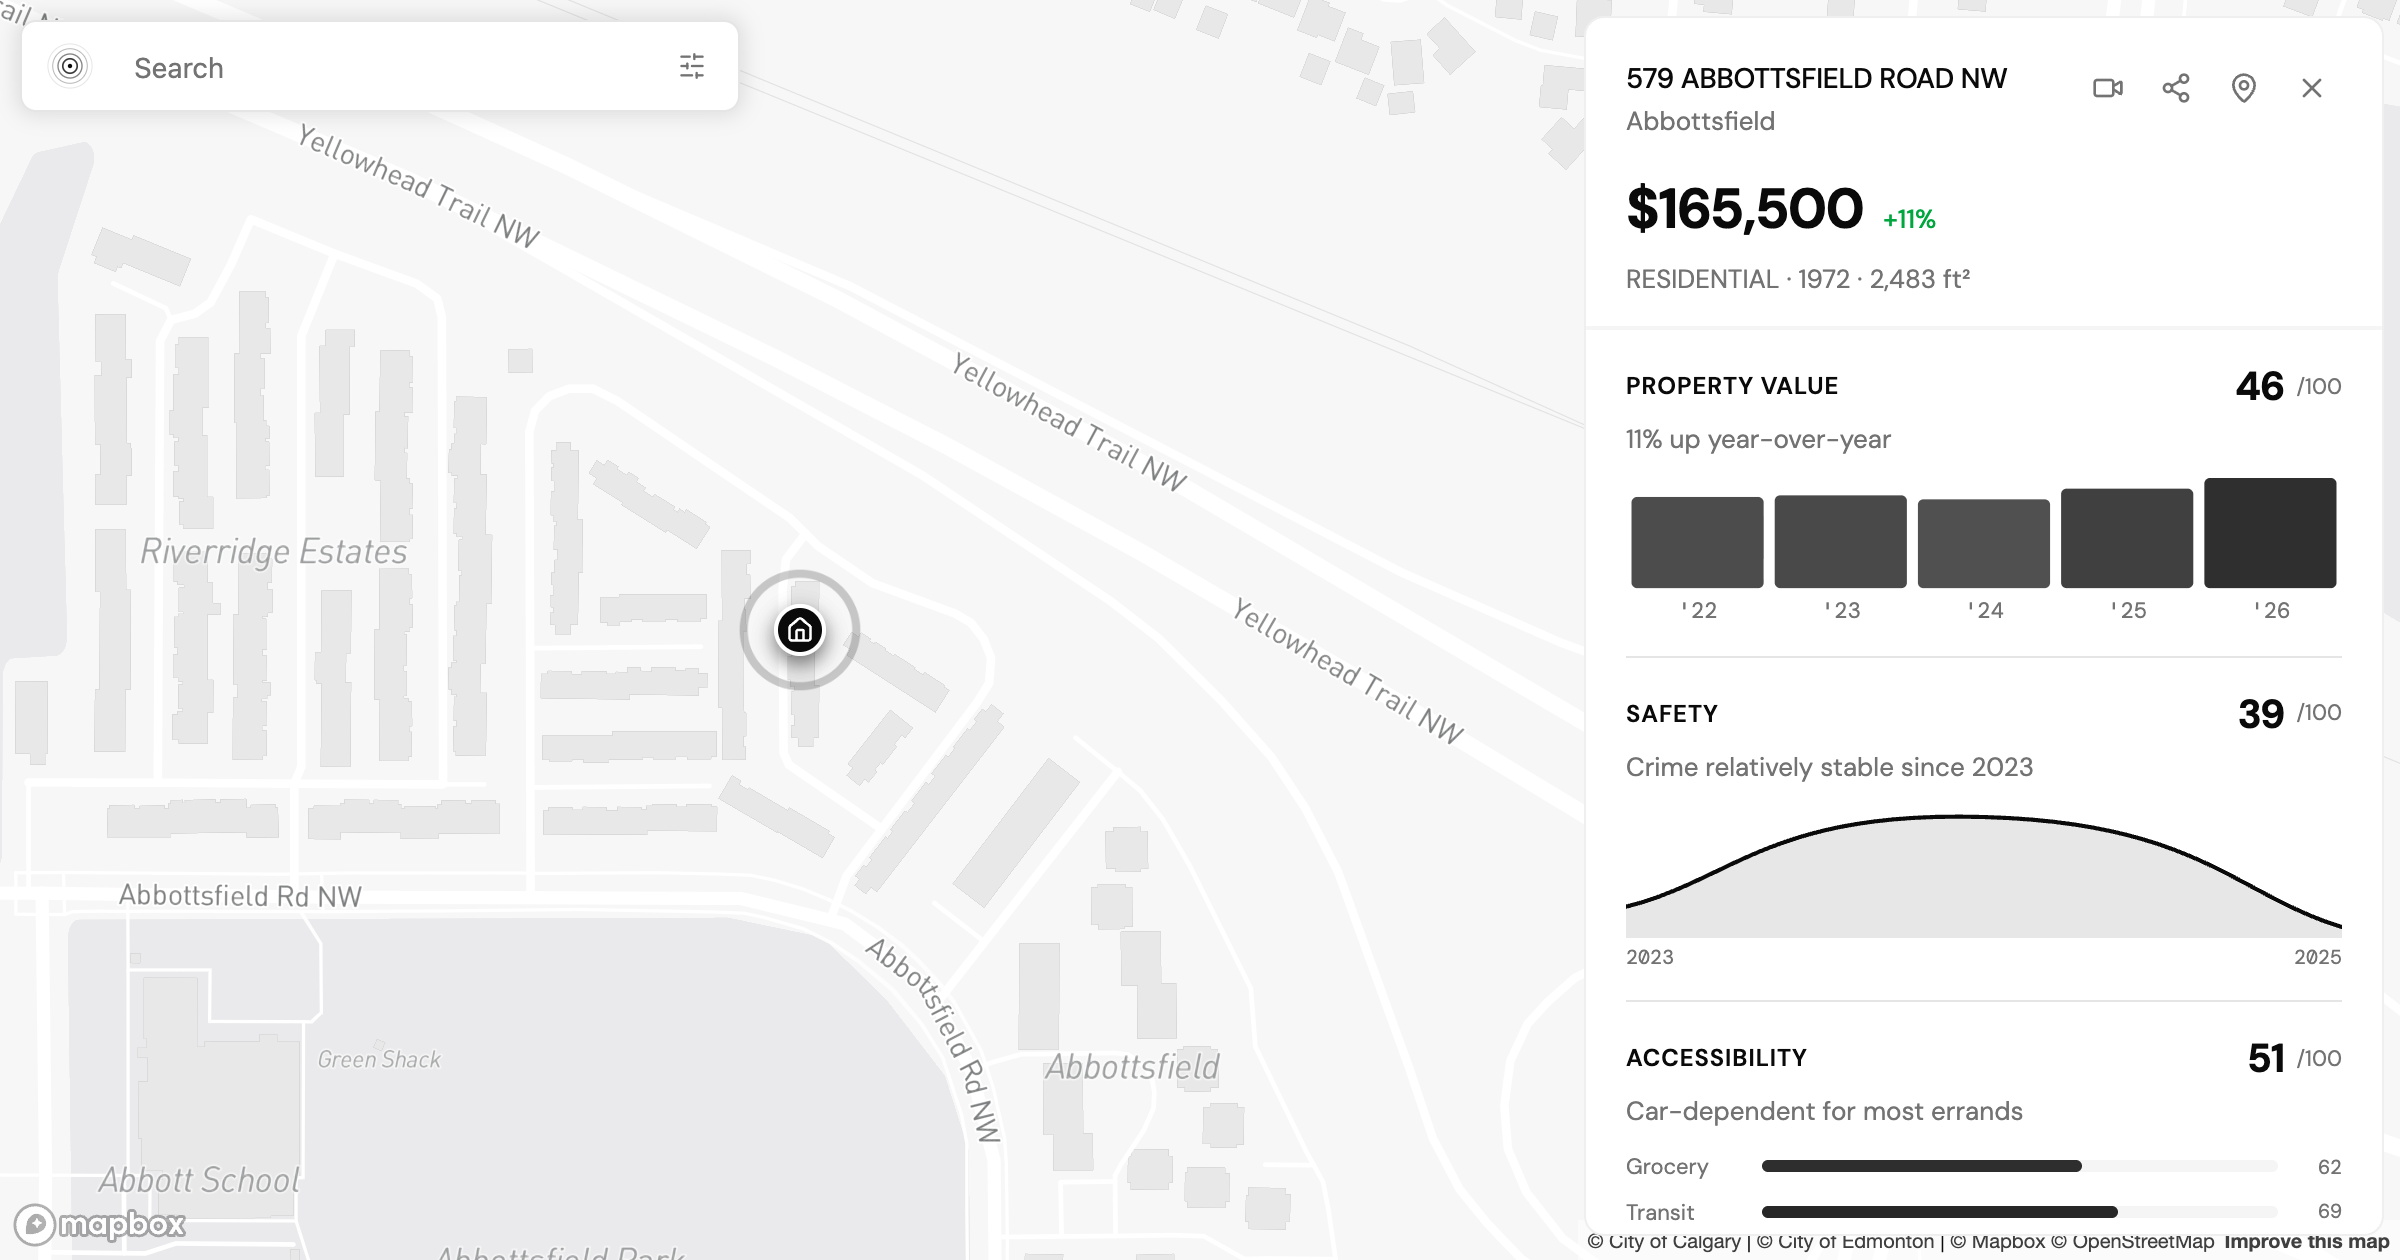
Is Abbottsfield Edmonton Safe? What the Crime Data Shows
Is Abbottsfield Edmonton safe? We read the Edmonton Police Service crime data for this northeast community, category by category, against the safety score.
Check a neighbourhood
Every neighbourhood has a page with its safety rank, what that rank measures and what it cannot tell you. Free, and no account.
Check a neighbourhood