Is Oakwood Village Toronto Safe? What the Crime Data Shows
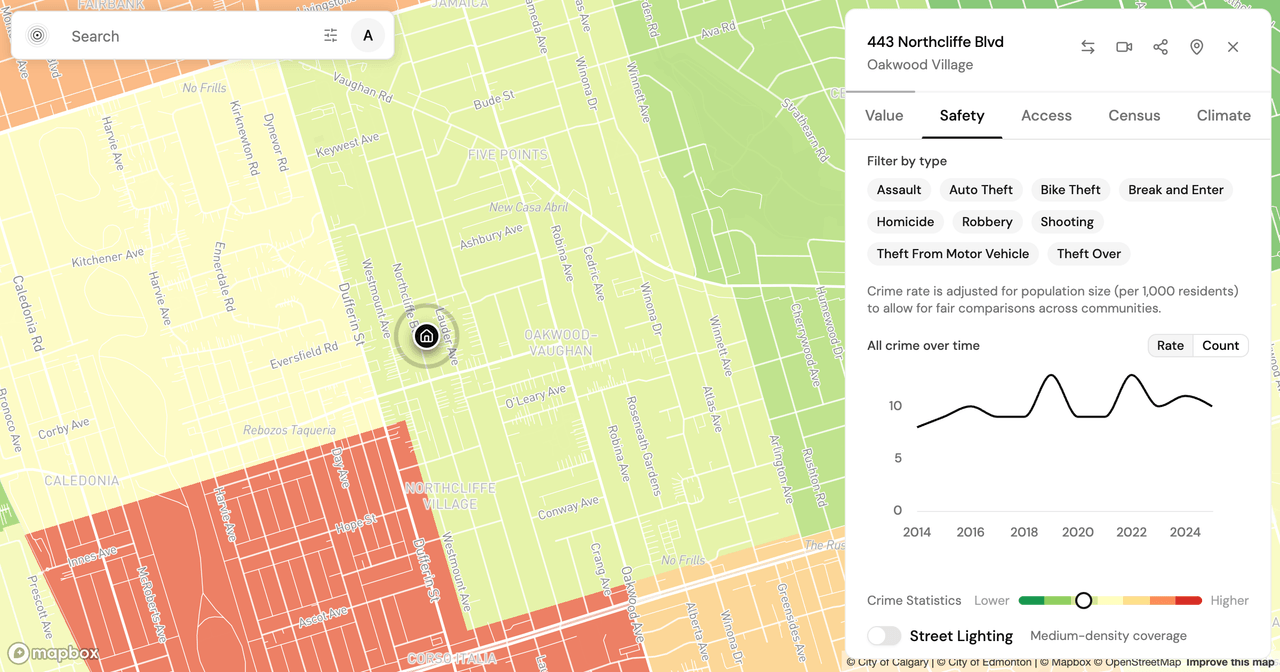
Data freshness: Toronto Police Service community-level crime statistics through year-end 2025, pulled live from the PickYourPlace database on 2026-08-31. Population and demographics from the Statistics Canada 2021 Census. Every neighbourhood figure below comes from that same pull. See the note at the end for what these numbers do and don't cover.
You've found a house in Oakwood Village that fits your budget, which in west-central Toronto is worth pausing on. Then you read a few contradictory comments online about whether the area is "fine" or "sketchy," and you come away less sure than before you looked. Anecdote is loud, and it rarely agrees with itself.
So here is the more useful question: is Oakwood Village Toronto safe, and how should you read the actual data before you make an offer? Oakwood Village scores 70 out of 100 for safety. That number is a fair place to start. It is not the answer.
A safety score is where the reading starts
PickYourPlace scores every Toronto community for safety on a 0-to-100 scale, built from measures that are each ranked against the rest of the city. Reported crime is the largest single input, at just under a third of the weight. The rest blends traffic incidents, street-lighting density, distance to fire, police, and healthcare services, and neighbourhood noise. So a score in the seventies is a summary of several things at once, not a single verdict about crime.
Read on its own, a number like 70 invites a snap judgment in the other direction: strong, done, move on. Treat it instead as a door. It tells you where a community stands relative to the rest of the city. It does not tell you which crimes drive it, which way they are trending, or how your block compares to the community average.
What Oakwood Village's 2025 numbers show
Oakwood Village recorded 231 reported incidents in 2025, which works out to 9.8 per 1,000 residents. Rate per 1,000 matters more than the raw count, because it accounts for how many people live in the community and lets you compare it to anywhere else in the city on the same footing. On crime volume relative to other Toronto neighbourhoods, Oakwood Village lands in the 32nd percentile, where lower means less volume, not more.
The trend is the part most reputation-based takes miss. All-crime incidents in Oakwood Village fell 11.9% year over year. So the community carries a moderate incident rate that is moving down rather than up. A single score flattens those two facts into one, and the direction of travel is often the more decision-relevant of the two.
The category mix pulls in different directions
A neighbourhood with a lot of car break-ins is a different lived experience than one with a lot of assaults, even at the same total. Oakwood Village's three largest categories do not move together:
- Assault: 152 incidents, 6.5 per 1,000, up 10.9% year over year. This is the largest single category and the one that most shapes how a place feels day to day. It is the one meaningfully on the rise.
- Auto theft: 47 incidents, 2.0 per 1,000, down 4.1%. Auto theft has been a Greater Toronto Area story for a few years, so a decline here is worth noticing rather than assuming.
- Theft from motor vehicle: 33 incidents, 1.4 per 1,000, up 22.2%. The smallest of the three by rate, but rising fastest. If you park on the street, this is the risk the data points at most directly, and it is largely the kind you can plan around through where and how you park.
How all-crime down and assault up are both true
The headline says all-crime fell 11.9%. The largest category, assault, rose 10.9%. Both come from the same pull, and both are accurate. All-crime is reported as its own series rather than as a simple sum of the categories (which is also why the three categories above can add up to more than 231), and it tracks a community where several other categories fell sharply: break and enter dropped 46.8%. That is how the total can fall even as assault climbs. This is why a single figure can mislead. Read only the falling total and you miss that the category most tied to how a street feels is heading the other way; read only assault and you miss that the broader picture is improving. The honest read holds both at once.
The rest of the safety score
Crime is the biggest input, but the score of 70 reflects more than the incident lines above. The same score weights traffic incidents, street-lighting density, and how close the nearest fire, police, and health services sit, along with a neighbourhood noise reading. Those factors are part of why a community's safety score and its crime-volume percentile can differ. To see each component and each crime category with its trend, the safety lens for Oakwood Village breaks the score into the same figures used here, and you can read how the safety data is built if you want the assembly.
From a score to your own question
Safety is rarely the only lens that decides a purchase. Oakwood Village splits close to evenly between owners and renters, at 50.2% owner by the 2021 Census, runs a median age of 42, and puts 37 grocery and food options within a 15-minute walk. Its modelled median property value is $1,100,000, a 2024-vintage estimate from Census-based modelling rather than an assessed or roll value. Those sit alongside the crime picture, not after it.
When you have a specific Oakwood Village address in mind, an Analyze report pulls the safety breakdown together with property value, accessibility, and census data for that address. If you would rather ask in plain language how the categories or trends read for the community, the neighbourhood advisor works from the same figures. Both start from the Toronto communities view.
The data will not make the call for you, and it should not. What it does is replace a contradictory comment thread with the actual numbers, their direction, and their limits, so you frame your own question instead of adopting someone else's verdict.
What the data doesn't capture
Reported crime is a strong signal, but it is one signal. It does not include unreported incidents, a known gap for low-level theft and harassment. It flattens time-of-day and block-level variation into an annual community total, so a quiet street and a busier one share a score. And per-1,000 rates use residential population, which can read differently for communities that draw a large daytime or through population. Numbers describe a place. They do not decide it for you.
Keep reading

Is Highland Park Calgary Safe? Reading the Inner-North Crime Data
Is Highland Park Calgary safe? We pulled the Calgary Police crime data for this inner-north community and read a safety score of 49 category by category.
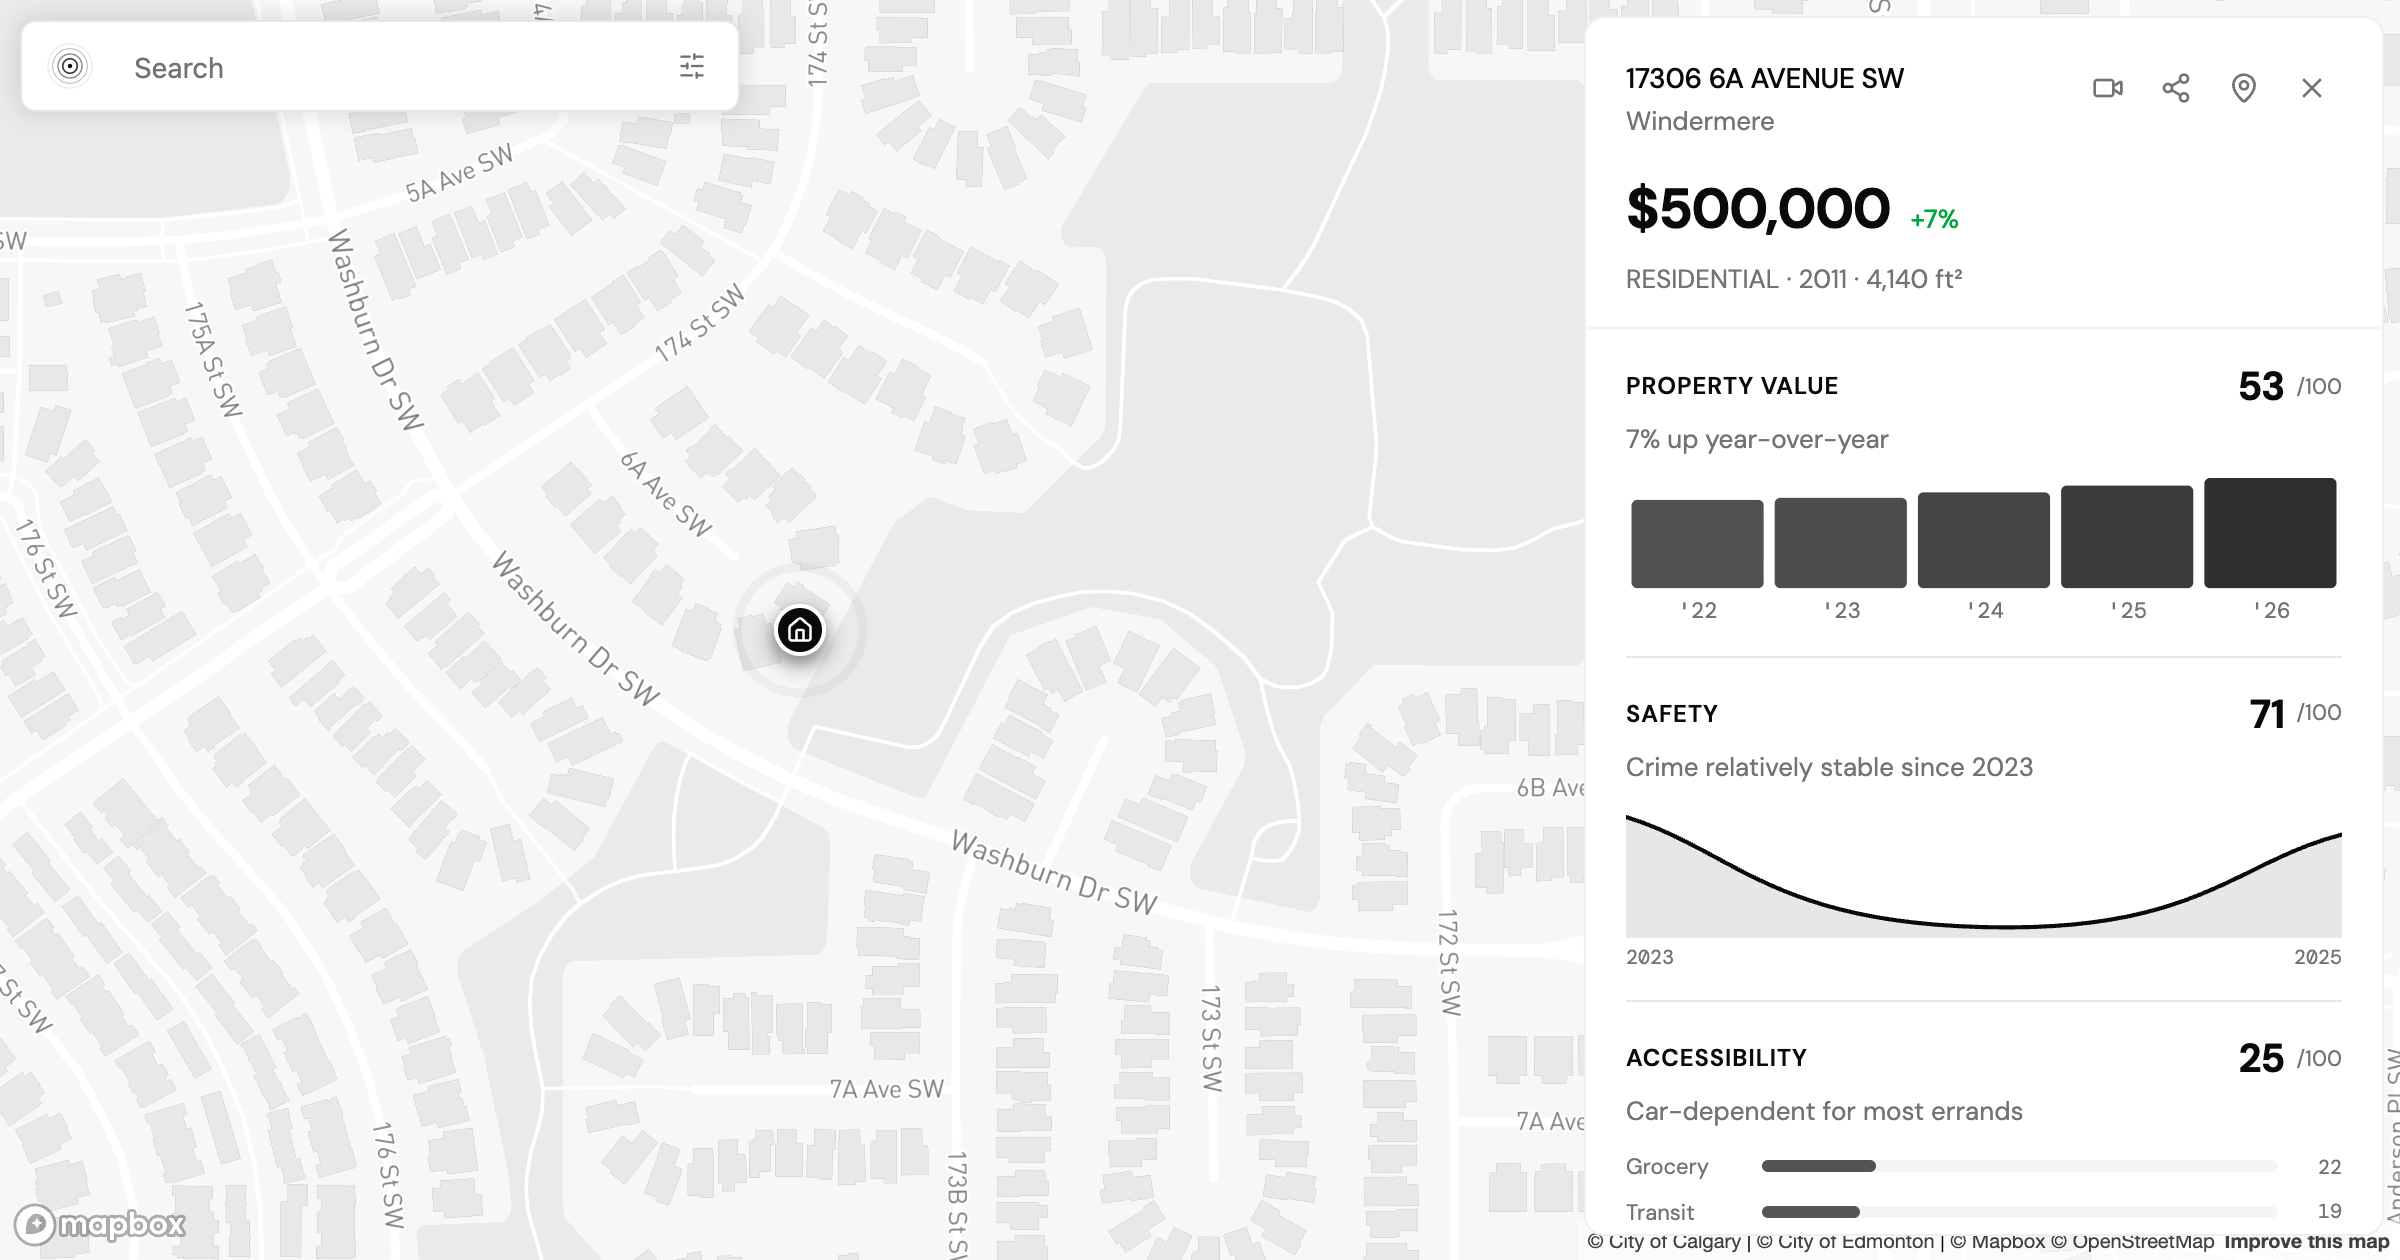
Allendale vs Windermere: Two Edmonton Neighbourhoods, Side by Side
Allendale vs Windermere in Edmonton: two communities at nearly the same assessed value that split on transit, safety, and who lives there. What the data shows.
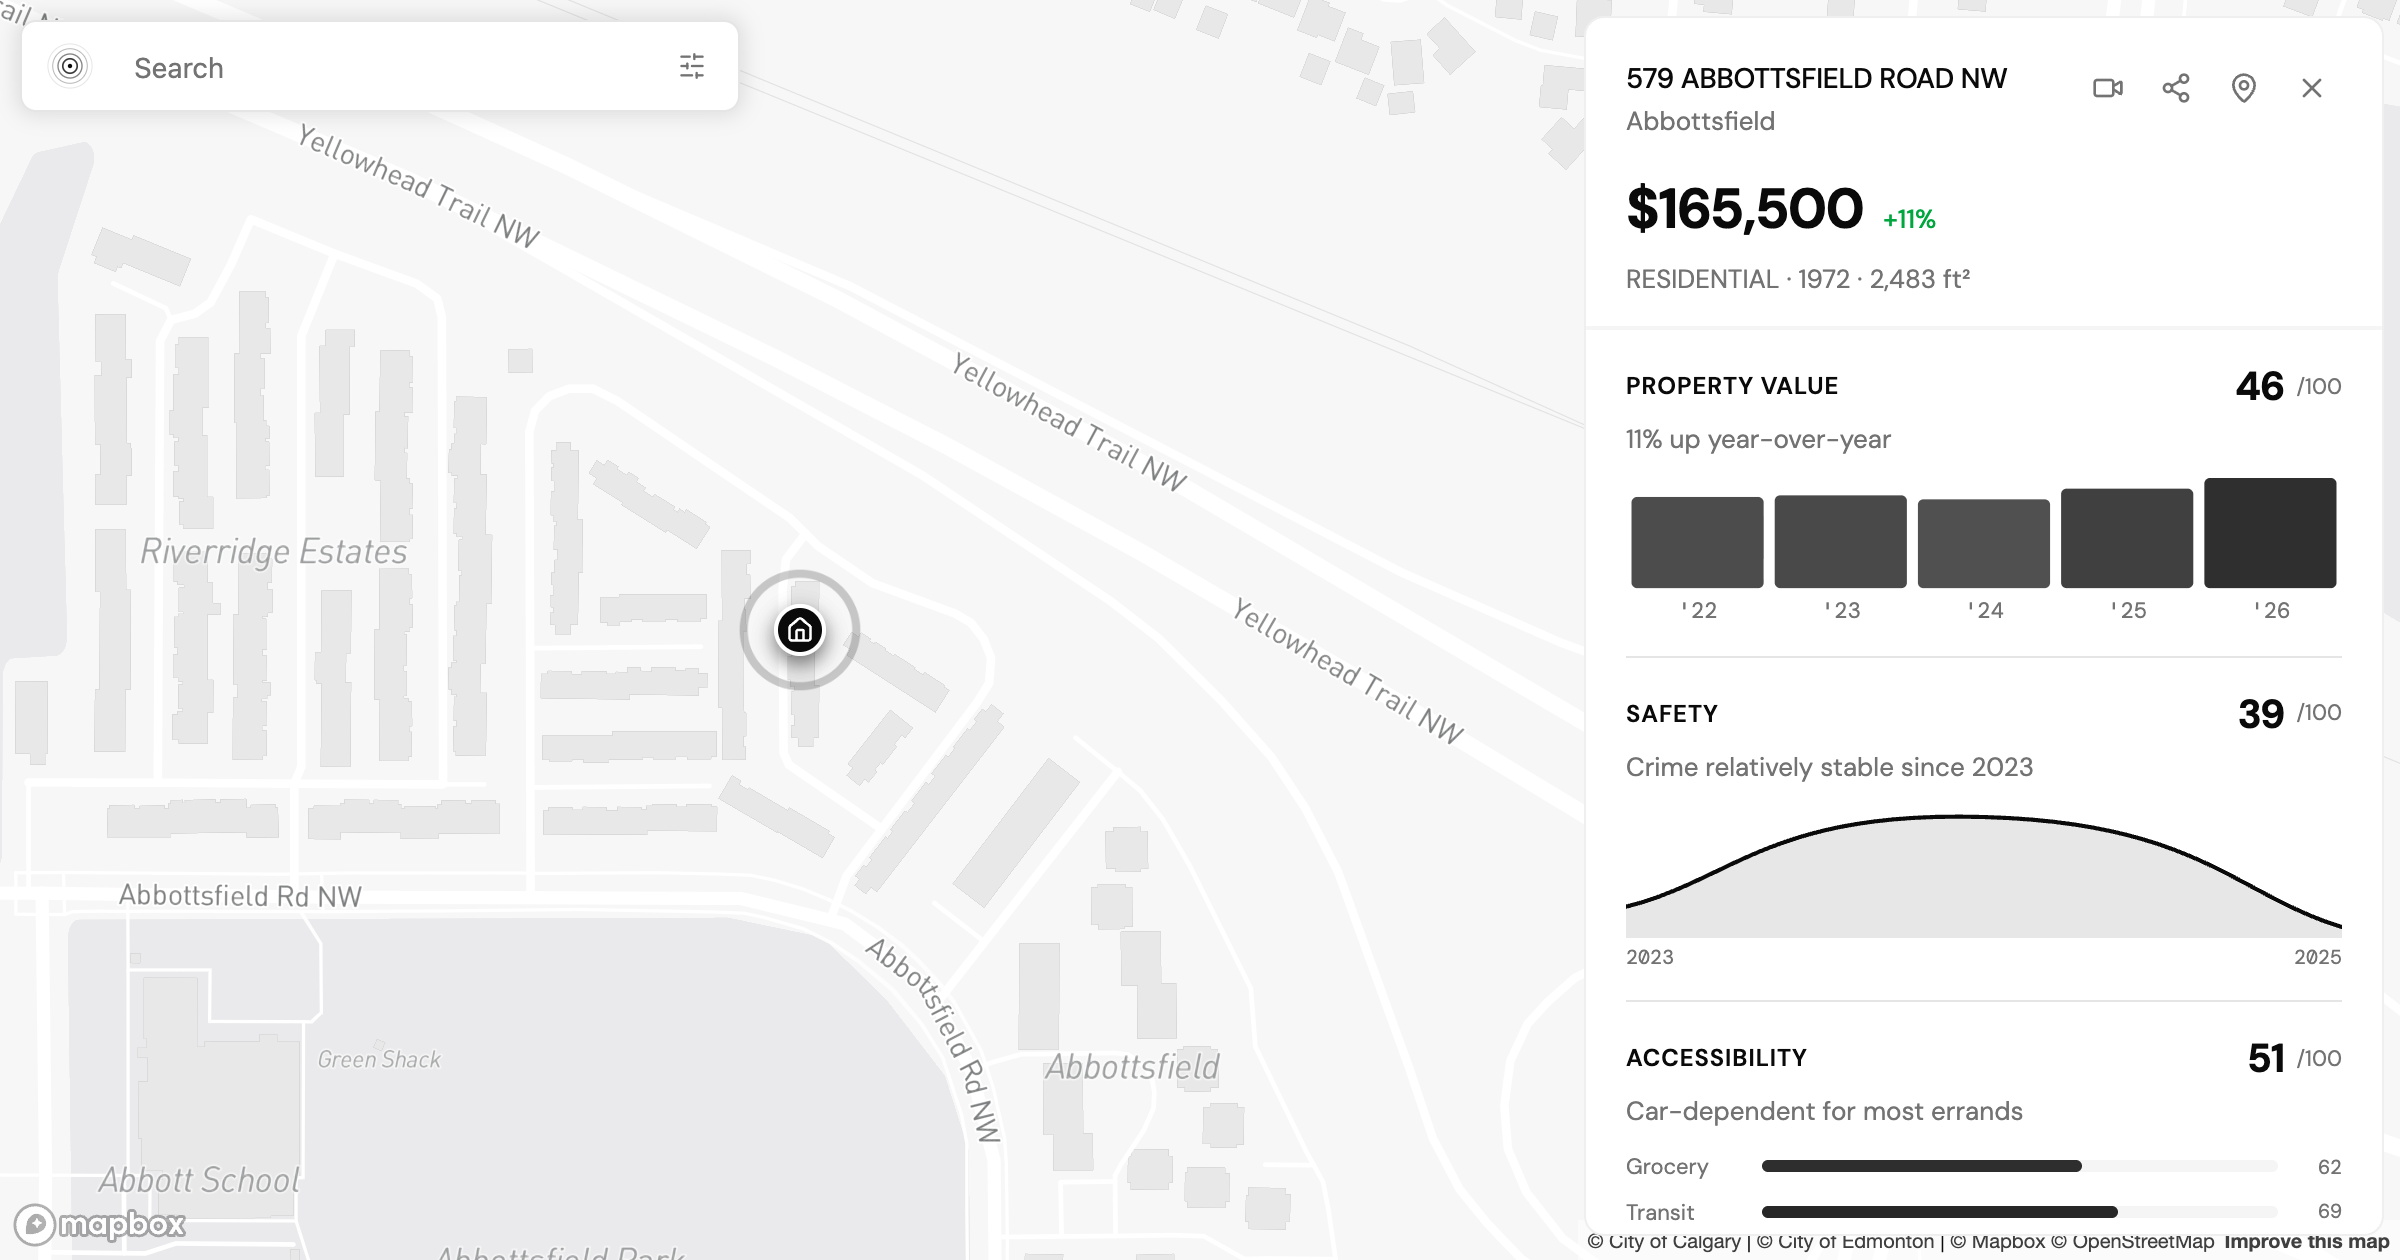
Is Abbottsfield Edmonton Safe? What the Crime Data Shows
Is Abbottsfield Edmonton safe? We read the Edmonton Police Service crime data for this northeast community, category by category, against the safety score.
Check a neighbourhood
Every neighbourhood has a page with its safety rank, what that rank measures and what it cannot tell you. Free, and no account.
Check a neighbourhood