Is Pelmo Park-Humberlea Safe? How to Read Northwest Toronto's Crime Data Before You Buy
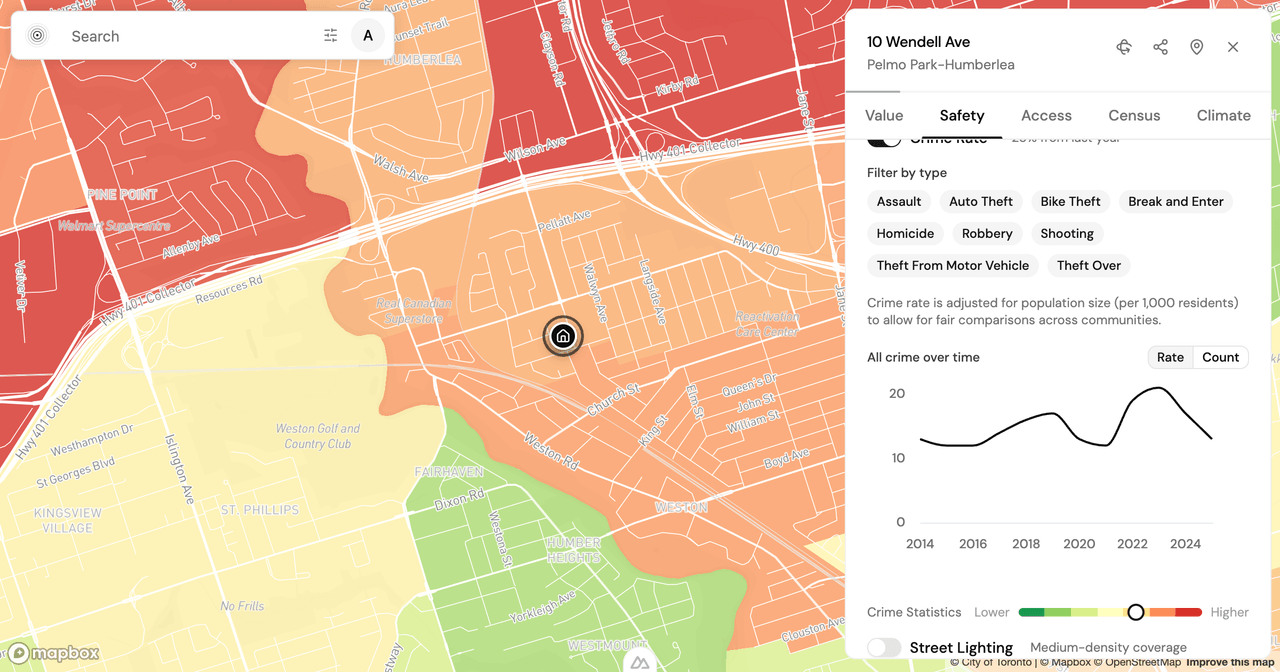
Data freshness: Toronto Police Service community-level crime statistics through year-end 2025, pulled from the PickYourPlace database on 2026-08-26. Population and demographics from the Statistics Canada 2021 Census. Every neighbourhood figure below comes from that same pull. See the note at the end for what these numbers do and don't cover.
You've found a house in Pelmo Park-Humberlea that works on paper: detached, a yard, a price that still clears in a corner of northwest Toronto where that's getting rare. Then the second-guessing starts. You search the community name, land on a safety score in the thirties, and feel the offer you were ready to make drift further away. A number in the thirties reads like a warning. Read properly, it often argues the opposite.
So the more useful question is not whether the score is low, but what the underlying crime data shows and how you should weigh it before you make an offer.
A safety score of 39 is where the reading starts
PickYourPlace scores Toronto communities for safety on a 0-to-100 scale, a weighted blend of reported crime alongside factors like traffic and proximity to emergency services, each ranked against the rest of the city. Pelmo Park-Humberlea scores 39. On its own, that reads low, and it's easy to stop reading there.
Don't. A score tells you where a community stands relative to the rest of the city on one composite measure. It doesn't tell you which crimes drive it, which direction they're moving, or how any of it lands on the block you're actually looking at. A score of 39 is a prompt to look closer, not a verdict to act on.
What the 2025 numbers show, and where they're heading
Pelmo Park-Humberlea recorded 163 reported incidents in 2025, or 12.9 per 1,000 residents. The rate matters more than the raw count, because it accounts for how many people live in the community and lets you compare it to anywhere else in the city on the same footing.
The part a static score hides is the direction. All-crime incidents in the community fell 25.2% year over year, a quarter in a single year. Separately, the community's rate sits around the 66th percentile citywide for crime volume, above the city's middle, and that rate is dropping steeply. Those are two separate facts, and the second is usually the more decision-relevant. A community sitting still at a low number and one falling fast from a higher one are not the same place, even when this year's scores happen to match.
The category mix changes the read
"Is it safe" isn't one question. A neighbourhood with mostly car break-ins is a different daily experience than one with mostly assaults, even at the same total. Pelmo Park-Humberlea's three largest categories are all falling, and steeply:
- Assault: 78 incidents, 6.2 per 1,000, down 24.9% year over year. The largest single category and the one that most shapes how a place feels day to day.
- Auto theft: 47 incidents, 3.7 per 1,000, down 27.7%. Auto theft has been a Greater Toronto Area story for years, so a decline this sharp in one community is worth noticing rather than assuming.
- Theft from motor vehicle: 29 incidents, 2.3 per 1,000, down 34.1%. The steepest drop of the three. If you park on the street, this is the risk the data points at most directly, and it's the kind you can largely plan around through where and how you park.
Those three don't sum to the full 163; the rest is spread across smaller categories. The point of the breakdown isn't to add it back up. It's that all three of the largest categories are moving the same way (down), a more coherent signal than any single year's total.
What the score leaves out
Safety is one lens, and a purchase turns on more than one. Pelmo Park-Humberlea is heavily owner-occupied (81.3% owners to 18.5% renters by the 2021 Census) with a median age of 42 and an average household of 2.9 people. That profile reads as a settled, family-weighted community rather than a transient one.
Its northwest geography cuts the other way. The community scores 28 for accessibility and sits in the 33rd percentile for transit, with 5 grocery stores reachable in a 15-minute walk. If a short transit commute is near the top of your list, that's a real trade-off to weigh against the falling crime trend, not a footnote to it. If you prioritize space and ownership stability, the data reads one way; if you prioritize walkable transit access, it reads another. The numbers describe the trade-off. They don't settle it for you.
From a score to a specific address
Community averages are one layer. The block is another, and they can diverge. To go deeper:
- Open a Pelmo Park-Humberlea address on the Explore map and choose the Safety tab to see each crime category and its trend, the figures used above. An Analyze report carries the same breakdown for a specific address, and the Pelmo Park-Humberlea safety page sets the score against the rest of Toronto.
- To see how the crime, street-lighting, and traffic layers on the Safety lens came together, read the Safety lens update.
- The Explore map lets you toggle safety, accessibility, and census layers across the rest of Toronto, so you can see how the community sits against its neighbours.
When you have a specific address in mind, an Analyze report pulls the full safety breakdown (every category and its year-over-year trend) together with property value, accessibility, and census data for that address, so the safety reading sits next to the other things the decision turns on.
Start with the highest-rate category, then check its trend. In Pelmo Park-Humberlea, the largest category and the steepest decline both point the same direction, exactly the thing a single number in the thirties will never tell you.
What the data doesn't capture
Reported crime is a strong signal, but it is one signal. It doesn't include unreported incidents, a known gap for low-level theft and harassment. It flattens time-of-day and block-level variation into an annual community total, so a quiet street and a busier one share a score. And per-1,000 rates use residential population, which reads differently for communities with large daytime or through traffic. Numbers describe a place. They don't decide it for you.
Keep reading

Is Highland Park Calgary Safe? Reading the Inner-North Crime Data
Is Highland Park Calgary safe? We pulled the Calgary Police crime data for this inner-north community and read a safety score of 49 category by category.

Is Oakwood Village Toronto Safe? What the Crime Data Shows
Is Oakwood Village Toronto safe? We read the Toronto Police crime data by category and trend to show how to turn a safety score into a question you can act on.
Allendale vs Windermere: Two Edmonton Neighbourhoods, Side by Side
Allendale vs Windermere in Edmonton: two communities at nearly the same assessed value that split on transit, safety, and who lives there. What the data shows.
Check a neighbourhood
Every neighbourhood has a page with its safety rank, what that rank measures and what it cannot tell you. Free, and no account.
Check a neighbourhood