Best Family Neighbourhood in Calgary: Auburn Bay vs Mahogany
Type "best family neighbourhood Calgary" into a search engine and you get the same thing every time: a ranked list of five or six community names, no sources, and no explanation of what "family friendly" is supposed to mean. The problem is that family friendliness is not one number. It is a bundle of things (how many households have children, whether neighbours tend to own or rent, how old the typical resident is, how much a home costs, how safe the streets are, and how far you have to travel for a carton of milk), and every family weighs those differently.
So instead of ranking, this post reads the data for two established communities in southeast Calgary that come up often in family searches: Auburn Bay and Mahogany. Both are lake communities built in the last two decades, both draw young families, and on paper they look similar. Where they differ turns out to be exactly the kind of trade-off a growing family has to decide for itself. Here is what the numbers show, and how to run the same check for your own shortlist.
Data freshness: household, age, and tenure figures are from the Statistics Canada 2021 Census, and assessed values from the City of Calgary 2026 roll. Crime figures are Calgary Police Service community statistics; accessibility figures are 15-minute walk isochrones. Every neighbourhood number below was pulled live from the production database on 2026-07-13. Crime-volume percentiles rank each community against the rest of Calgary; accessibility is a score out of 100.
What "best family neighbourhood" really means in the census data
Before comparing the two communities, it helps to name the signals the census actually carries, because "good for families" usually reduces to four of them.
- Average household size: the mean number of people living under one roof. Larger averages, closer to or above 3.0, tend to indicate more households with children rather than singles or couples.
- Tenure mix: the split between owner-occupied and rented homes. A higher ownership share is associated with longer tenures and more settled family populations, though on its own it says nothing about quality of life.
- Median age: the age at which half the residents are older and half younger. A median in the mid-thirties usually points to households raising young children rather than students or retirees.
- Assessed value: the City of Calgary's estimate of what a property is worth, which sets both your entry price and your annual property tax.
None of these is a verdict. Each is a door into what daily life in a community looks like. Read together, they sketch who your neighbours are likely to be.
Auburn Bay by the numbers
Auburn Bay's census profile reads like a young-family community. The average household size is 3.0, the median age is 34, and 75.3% of homes are owner-occupied against 24.8% rented. The median assessed value is $451,750, up 44.0% over five years and down 2.0% year over year, which puts it among the more affordable of the southeast lake communities.
On safety, Auburn Bay recorded 112 reported incidents, or 6.4 per 1,000 residents, and sits in the 17th percentile for crime volume citywide. In plain terms, most Calgary communities report more incidents than Auburn Bay does, and all-crime is down 5.8% year over year. Those are scored figures, not a promise: they do not capture unreported incidents or very recent shifts.
The trade-off shows up in accessibility. Auburn Bay has two grocery options within a 15-minute walk and an accessibility score of 29 out of 100, which is what you would expect from a lake community built around a central amenity rather than a high street. If walking to daily errands matters to you, that is the number to weigh. The full read is on Auburn Bay's community page.
Mahogany by the numbers
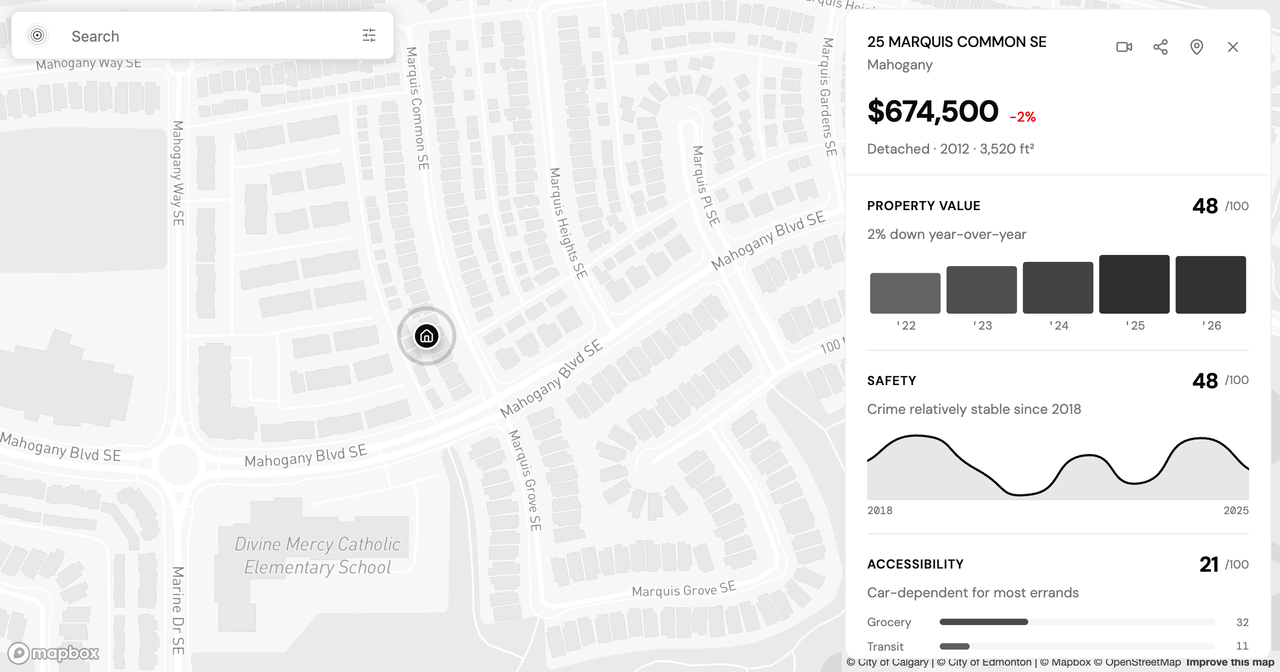
Mahogany's household profile looks a lot like its neighbour's, with a different cost and convenience story. The average household size is 2.8, the median age is also 34, and ownership is a touch higher at 78.4% owner-occupied to 21.7% rented. The clearest difference is price: the median assessed value is $674,500, up 44.4% over five years and down 2.0% year over year, roughly $220,000 above Auburn Bay for a comparable household mix.
On safety, Mahogany recorded 106 reported incidents, or 9.0 per 1,000 residents, placing it in the 27th percentile for crime volume citywide, with all-crime down 9.4% year over year, a steeper decline than Auburn Bay's. The Mahogany census lens carries the demographic detail behind those figures, and the community page collects the rest.
Accessibility is where Mahogany asks the bigger question. It has one grocery option within a 15-minute walk and an accessibility score of 21, lower than Auburn Bay's. For a household running the daily school-and-errands routine, a single grocery option within walking distance usually means a second vehicle. That is not a mark against the community; it is a cost to plan for.
Where the two converge, and where they diverge
Put side by side, Auburn Bay and Mahogany agree on the things that make a community read as family-oriented and diverge on the things a family actually budgets around.
They converge on demographics: near-identical median ages of 34, similar household sizes of 3.0 and 2.8, and ownership shares in the mid-to-high seventies. Both have low crime volume by citywide standards, and both show all-crime declining year over year. If your priority is being surrounded by other young families in an owner-heavy, low-incident community, the data does not separate them by much.
They diverge on two axes. The first is price: Mahogany carries roughly $220,000 more in median assessed value, which changes your down payment, your monthly carrying cost, and your annual tax bill. The second is walkability: Auburn Bay's two walk-reachable groceries and higher accessibility score make a real difference to a car-light routine, while Mahogany leans harder on driving. Neither pattern makes one community "better." If you prioritize a lower entry price and slightly more on foot, the data points to Auburn Bay. If you prioritize the specific home or lake access Mahogany offers and can absorb the cost and the second vehicle, the data supports that too. The "best family neighbourhood" in Calgary is not a fixed address; it is the one whose trade-offs match yours. A ranking list cannot know which trade-off is yours to make. The census can help you see it.
How to run your own household-fit check
A citywide comparison is a starting point, not an answer, because "family friendly" depends on your family. To turn these figures into a decision keyed to your situation, run a personalized report.
- Open Analyze and enter an Auburn Bay or Mahogany address, or select the community.
- Choose the metrics that matter to you. For a growing family, the Census and Safety lenses do most of the work.
- Select the Growing Family profile and note who is moving with you. The report frames each section around a family: walkable schools and parks in the accessibility section, the age mix and school-age population in the census section, and the weakest climate hazard for insurance and planning.
- Generate the report and read it against your own household. When you are buying, the census section also shows the monthly ownership cost for the area.
The Growing Family profile is part of HomeSeeker, and the 7-day free trial runs it without a credit card, so you can compare two shortlisted addresses before deciding whether the plan is worth it.
What to look at next
Whichever way your shortlist leans, treat the community numbers as the first lens, not the last word. Auburn Bay and Mahogany are two of dozens of Calgary communities where the census tells a family-oriented story, and the same read applies to any of them. From here, open the demographics and safety lenses on the community pages, generate a full report for the address you are actually considering, and share it with your agent before the showing. If there is a community you would like this comparison run for next, or a figure you wish the report surfaced, I would love to hear it. Your feedback shapes what PickYourPlace measures.
Keep reading

Is Highland Park Calgary Safe? Reading the Inner-North Crime Data
Is Highland Park Calgary safe? We pulled the Calgary Police crime data for this inner-north community and read a safety score of 49 category by category.

Is Oakwood Village Toronto Safe? What the Crime Data Shows
Is Oakwood Village Toronto safe? We read the Toronto Police crime data by category and trend to show how to turn a safety score into a question you can act on.
Allendale vs Windermere: Two Edmonton Neighbourhoods, Side by Side
Allendale vs Windermere in Edmonton: two communities at nearly the same assessed value that split on transit, safety, and who lives there. What the data shows.
See where the data comes from
Every source, and the four rungs between a public record and a sentence about your life, each with what it cannot tell you.
See where the data comes from