Calgary Climate Risk by Neighbourhood: Reading the Lens
A brand-new community in southwest Calgary tells you a lot about a house and almost nothing about the ground it sits on. The listing has the beds, the bathrooms, the assessed value. What it rarely tells you is how the site behaves in a wet spring or a dry, smoky August. For a family putting $375,000 to $700,000 into a new Calgary suburb, that gap has stopped being academic. After the 2013 flood and several summers of wildfire smoke, climate risk has become one of the first things buyers want to weigh by neighbourhood, and one of the last a property listing tells them anything about.
That is the gap PickYourPlace's climate lens is built to close. In this post, I will walk through what the climate lens measures, what it reports for two Calgary communities on opposite ends of the build-out (Wolf Willow in the southwest and Mahogany in the southeast), and how to read a single climate score as a door into the specific hazards underneath it, rather than as a verdict on a place.
What the climate risk lens measures, and what it doesn't
On the Explore map, the climate lens breaks an address down into six natural hazards: flood, wildfire, earthquake, landslide, radon, and severe weather. Each hazard gets a score out of 100, where a lower number means higher modelled hazard, and the lens also shows where that score ranks against the rest of Calgary. Both numbers are relative. They tell you how an address's modelled exposure compares with other places, not whether it is "safe" in some absolute sense. For most new suburbs, flood and wildfire are the two that carry the decision, so those are the two I focus on here.
Two terms are worth defining before the numbers. A composite hazard score blends the modelled hazard layers into one score out of 100 so you can see relative exposure at a glance. An observed score reflects the historical record (events that have actually happened nearby), and the lens charts those events over time alongside the composite. The underlying data comes from Natural Resources Canada (NRCan) hazard modelling and the Canadian Hydrospatial Network for flood, so the numbers are drawn from national datasets rather than local reputation.
The design choice that matters most: the composite score is a starting point, not a headline. A single number cannot tell you whether the exposure is flood or wildfire, or at what level, so the point of the lens is to open that number into its parts.
Wolf Willow: a new community in the southwest
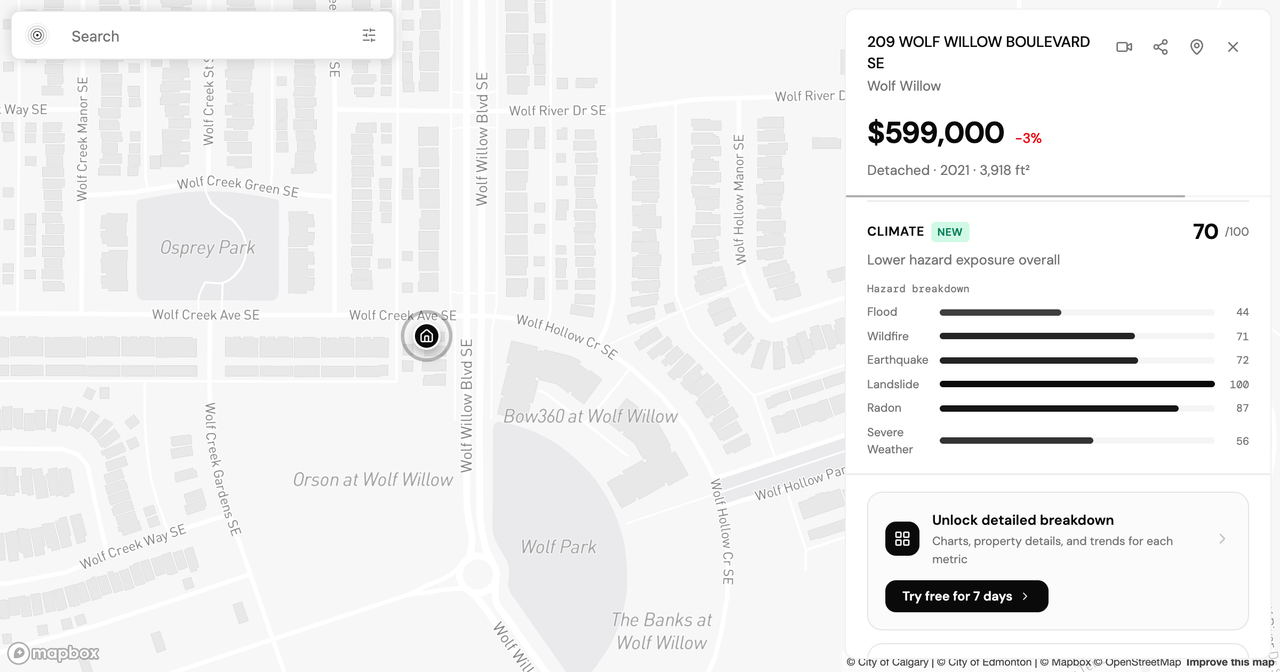
Wolf Willow is one of Calgary's newer southwest communities, and its numbers read like a place still filling in. Its value score is 67 out of 100, and assessed values there run a median of $376,000 on the 2026 roll, up 56.8% over five years even after a slight 1.0% dip year over year. The trade-off shows up in daily errands: there are still zero grocery stores within a 15-minute walk of the community's centre, and its census profile (a median age of 33, an average household of 2.6 people, and 88.1% owner-occupancy) fits a young, recently settled suburb.
On the climate lens, Wolf Willow scores 44 out of 100 for flood and 71 for wildfire, and its composite climate score is 70. These are resilience scores, so a lower number means higher modelled hazard. All three sit in the bottom tenth of Calgary communities (the 4th, 6th, and 7th percentiles), which is the signal to read the flood row closely rather than stop at the composite. The Wolf Willow climate page summarizes the composite and its weakest component; the hazard-by-hazard rows and the historical event charts live on the Climate tab of the Explore map.
Mahogany: a more established community in the southeast
Mahogany, built around a lake in the southeast, is a few years further along, and its profile shows it. Its value score is 48 out of 100, with a median assessed value of $674,500 on the 2026 roll, up 44.4% over five years and down 2.0% year over year. Everyday access is a little further ahead than Wolf Willow's, with one grocery store inside a 15-minute walk, and its census profile skews slightly older and larger: a median age of 34, a household size of 2.8, and 78.4% owner-occupancy against 21.7% renters.
Mahogany's climate lens reports a flood score of 49 out of 100, a wildfire score of 74, and a composite climate score of 71, placing it in the 11th, 13th, and 11th percentiles citywide on the same lower-is-more-hazard reading. The Mahogany climate page gives the same composite-level summary, and the Mahogany neighbourhood guide sets that climate picture next to the community's safety and access data.
I am deliberately not ranking one community above the other on climate. A composite score that looks similar can hide very different exposures (one address weighted toward flood, another toward wildfire), and which one matters depends on your own risk tolerance, your insurance situation, and where the property actually sits within the community.
Reading the score as a door, not a rating
The most useful way to treat a climate score is as the first click, not the last word. A composite in the middle of the pack can still hide very different flood scores on two streets a few blocks apart, because these hazards follow elevation, drainage, and proximity to the wildland edge rather than the community boundary. The sequence I would follow: read the composite for orientation, open the flood and wildfire scores to see which hazard is driving it, then, for wildfire, check the historical event chart to see whether the modelled exposure has shown up in the record nearby. Flood has no event chart in the lens, so for flood the per-hazard score and the property's own position (elevation, and distance to the river or a drainage channel) are what you have to go on.
You can run that same walk yourself. Toggle the climate lens on Explore for any Calgary address, and the composite score expands into the per-hazard rows and event history, the same data behind the two community pages above.
Pairing climate with assessed value growth
Climate exposure reads differently once you set it beside how a community's value has moved. Wolf Willow's 56.8% five-year growth and Mahogany's 44.4% both sit well above a flat market, and neither figure tells you anything about hazard on its own. A strong appreciation trend and a low flood or wildfire score (higher modelled hazard) can, and often do, belong to the same address. If you prioritize entry price and growth headroom, the newer southwest community makes its case; if a shorter walk to daily amenities and a longer settled history matter more, the southeast one does. The climate lens does not break that tie for you. It makes sure the hazard side of the ledger is visible before you weigh it.
That is the whole intent behind opening the climate score into its parts: not to hand you a rating, but to make the trade-off legible so you can make the call. To see how an address scores across all five lenses, generate a full PickYourPlace report and read the climate section next to value, safety, and access rather than in isolation.
I would love to hear how this lands for your own search. If there is a Calgary community you want run through the climate lens, or a hazard you think the breakdown should surface more clearly, reach out and let me know.
Explore Calgary's climate data → | Generate a full neighbourhood report →
Keep reading

Is Highland Park Calgary Safe? Reading the Inner-North Crime Data
Is Highland Park Calgary safe? We pulled the Calgary Police crime data for this inner-north community and read a safety score of 49 category by category.

Is Oakwood Village Toronto Safe? What the Crime Data Shows
Is Oakwood Village Toronto safe? We read the Toronto Police crime data by category and trend to show how to turn a safety score into a question you can act on.
Allendale vs Windermere: Two Edmonton Neighbourhoods, Side by Side
Allendale vs Windermere in Edmonton: two communities at nearly the same assessed value that split on transit, safety, and who lives there. What the data shows.
See where the data comes from
Every source, and the four rungs between a public record and a sentence about your life, each with what it cannot tell you.
See where the data comes from