Calgary family neighbourhoods by census data: Tuscany and McKenzie Towne
"Best family neighbourhoods in Calgary" is one of the first things buyers with kids type before they've booked a single showing. The results are almost always the same shape: a ranked list of five or six community names, no sources, and no explanation of what "family-friendly" is supposed to mean. It's a fair question asked the wrong way. The neighbourhood that fits a household of five with two school-age kids and one car is not the same one that fits a couple planning their first child, and a ranking can't tell those two households apart.
Census data can. Statistics Canada measures the things "family-friendly" is really shorthand for: how large households are, how many residents own versus rent, the median age on the street, how densely people live. In this post, I'll walk through what PickYourPlace's Census & Demographics lens shows for two Calgary communities people ask about constantly, Tuscany and McKenzie Towne, pair those demographics with each community's accessibility and property-value numbers, and show you how to run the same read on any Calgary neighbourhood yourself. Every figure here comes from PickYourPlace's production data, pulled in June 2026. They are real numbers, never estimates.
Why "family-friendly" needs a census definition, not a ranking
A ranking does one thing: it collapses many different questions into a single order. That works for a race and fails for a home search, because the qualities a family cares about pull in different directions. A community can have large, owner-occupied households and a long walk to the nearest grocery store at the same time. Rank it once and you've hidden exactly the trade-off you were trying to see.
Census data keeps those dimensions separate. Four of them do most of the work when the question is about families:
- Household size: the average number of people living together in a dwelling. Larger averages point to more families with children under one roof rather than singles or couples.
- Ownership mix: the share of homes occupied by their owners versus renters. Owner-heavy communities tend to turn over more slowly, which many families read as stability.
- Age profile: the median age of residents, where half are older and half younger. It hints at whether you'll be surrounded by young families, established households, or an older, settled population.
- Density: how many people live per square kilometre. Lower density usually means detached homes and yards; higher density means attached housing and shorter distances.
None of these is a verdict on its own. Together they describe who already lives somewhere, which is the closest census gets to answering "would my family fit here?"
What the demographics lens shows in Tuscany
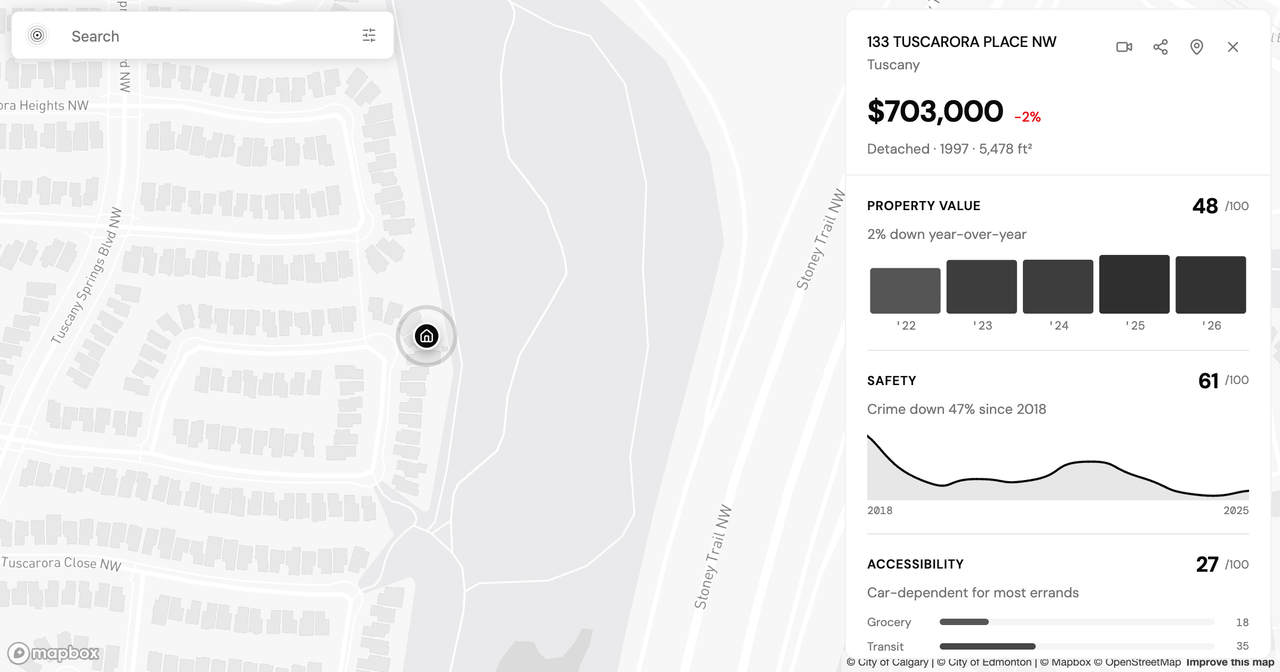
Tuscany sits on Calgary's northwest edge, and its numbers read like an established owner community. The Census lens puts the average household size at 3.0 people and the median age at 38. Ownership dominates: 88.5% of homes are owner-occupied against 11.1% rented. On property values, the 2026 assessment roll shows a median assessed value of $703,000, up 37.9% over five years and down 1.0% year over year, a community that appreciated strongly through the cycle and has flattened recently, in line with the wider Calgary market.
Accessibility is where the trade-off appears. The Accessibility lens scores Tuscany 27 out of 100, with exactly one grocery store reachable in a 15-minute walk and transit in the 35th percentile. That profile is common on the outer edge of the city: larger lots and quieter streets, bought at the cost of driving for most daily errands.
What the demographics lens shows in McKenzie Towne
McKenzie Towne, in the southeast, tells a different demographic story from a similar starting question. The average household size is 2.6 and the median age is 39, slightly smaller households and a marginally older middle than Tuscany. Ownership is still the majority at 78.1%, but renters make up 22.3%, roughly double Tuscany's share, which points to a more mixed housing stock of attached homes and rental units alongside detached houses.
On value, the median assessed home comes in at $499,250 on the 2026 roll, about $200,000 below Tuscany's median, with 42.9% growth over five years and the same 1.0% year-over-year dip. Accessibility scores higher: 49 out of 100, three grocery stores within a 15-minute walk, and transit in the 53rd percentile. McKenzie Towne was built around a main street, and the numbers show it.
Reading demographics and accessibility together
The interesting part isn't either community's scorecard in isolation. It's the gap between how family-oriented the demographics look and how the daily logistics score, because that gap is the trade-off you'd actually live with.
Tuscany reads as the more classically family-shaped community on paper: larger households, the highest ownership share of the two, detached-home density. But its accessibility score of 27 and single 15-minute-walk grocery store mean a car does most of the daily work. McKenzie Towne carries slightly smaller households and more renters, yet triples the walkable grocery count and sits mid-range for both accessibility and transit, at a median assessed value roughly $200,000 lower.
Safety is a third lens on top of both. Scored out of 100 against the rest of Calgary, the Safety lens puts Tuscany at 61 and McKenzie Towne at 49, a real difference, though both are scored measures of what public data captures, not a statement about how either street feels day to day.
So which fits a family better? The honest answer depends on the household doing the asking:
- If you prioritize a large-household, owner-dominated street and you'll drive for groceries and errands anyway, Tuscany's demographics line up, and the accessibility score is telling you to budget for that driving.
- If a shorter walk to daily errands and a lower entry price matter more, McKenzie Towne's mid-range accessibility and its median value near $499,250 point that way, with a more mixed ownership profile as the trade.
Neither is "the best family neighbourhood in Calgary." They're two different answers to two slightly different questions, and the census and accessibility numbers are what let you tell which question is yours.
How to run the same read on any Calgary neighbourhood
You don't need to take Tuscany and McKenzie Towne on faith. The same figures are available for every community in the city. Here's the sequence I'd use:
- Start with the census page. Open the Census lens for a community, such as Tuscany or McKenzie Towne, and read household size, ownership mix, median age, and density together rather than fixating on one number.
- Cross-reference accessibility. Check the same community's accessibility score and 15-minute walk counts. A family-shaped demographic profile with a low walkability score is a signal to price in a car and the time it costs, not a dealbreaker on its own.
- Weight the report to your own household. Generate a full report and personalize it: tell it you have two school-age kids and one car, and it re-weights the analysis around school proximity and walkability instead of the city-average buyer. Report personalization is a HomeSeeker feature, and it's included in the free 7-day trial, so you can pressure-test a shortlist before deciding whether to subscribe.
If you're moving to Calgary from another city and don't yet have a feel for which communities sit where, the relocator walkthrough is built for exactly that starting point. It frames each neighbourhood by the numbers rather than by reputation.
Census data won't hand you a single "family-friendly" winner, and that's the point. What it will do is show you the household you'd be joining and the daily logistics you'd be signing up for, so the trade-off is in front of you before you fall for a listing photo. I'd genuinely like to know which communities you're weighing and what the numbers surprised you about. Reach out any time, and tell me which cities and neighbourhoods you'd like covered next.
Keep reading

Is Highland Park Calgary Safe? Reading the Inner-North Crime Data
Is Highland Park Calgary safe? We pulled the Calgary Police crime data for this inner-north community and read a safety score of 49 category by category.

Is Oakwood Village Toronto Safe? What the Crime Data Shows
Is Oakwood Village Toronto safe? We read the Toronto Police crime data by category and trend to show how to turn a safety score into a question you can act on.
Allendale vs Windermere: Two Edmonton Neighbourhoods, Side by Side
Allendale vs Windermere in Edmonton: two communities at nearly the same assessed value that split on transit, safety, and who lives there. What the data shows.
Find my place
Say what matters to you and the whole city gets ranked against it, with what each place asks you to give up.
Find my place