Cranston and Flood Risk: What Calgary's Climate Lens Shows Before You Buy
Data freshness: Property values from the City of Calgary 2026 assessment roll. Demographics from the Statistics Canada 2021 Census. Climate scores use national hazard datasets, including Natural Resources Canada (NRCan), Health Canada, and Ouranos PAVICS. Neighbourhood figures were pulled from the canonical climate source on 2026-09-29. See the sources note at the end.
You've found a house you like in Cranston. The lot backs onto green space, the assessed value fits your budget, and the drive to Deerfoot is short. Then you remember June 2013, when flooding along the Bow and Elbow rivers damaged communities across Calgary, and you open a browser and type "cranston calgary flood risk." What comes back is mostly news archives and forum threads, not a number you can weigh against the rest of the decision.
That gap is why this post exists. Cranston sits on the southeast edge of the city, near the Bow River valley, and flood memory here runs deep. In this post, you will learn what PickYourPlace's climate lens measures, how to read Cranston's climate score as a starting point rather than a verdict, what to look for in the flood hazard layer, and how to weigh it against Cranston's property-value trend before you make an offer.
What the Climate Lens Covers
The climate lens is one of the five lenses in every PickYourPlace analysis, alongside Value, Safety, Accessibility, and Census. It scores each Calgary neighbourhood from 0 to 100, where a higher score means lower assessed hazard, and its composite blends seven hazards:
- Flood, from river and surface-water susceptibility.
- Wildfire, from historical burn extents and fuel exposure.
- Earthquake, from national seismic hazard modelling.
- Landslide, from inventoried slope failures and regulatory hazard zones.
- Radon, from measured indoor exposure potential.
- Severe weather, split into tornado and hail sub-perils.
- Heat, measured through Humidex threshold days.
The underlying data comes from national hazard datasets, including NRCan and Health Canada. Flood uses current susceptibility and historical events, not a 2050 forecast. The climate methodology states the sources and limits.
Reading Cranston's Composite Score as a Door
A single composite climate score is a summary, and a summary hides the parts that matter for a river-adjacent community like Cranston. The composite blends the hazards into one number, and for a community near a river the flood component is the one to check first. So the composite is a door, not a verdict: it tells you whether to look closer at the per-hazard breakdown, not whether to buy.
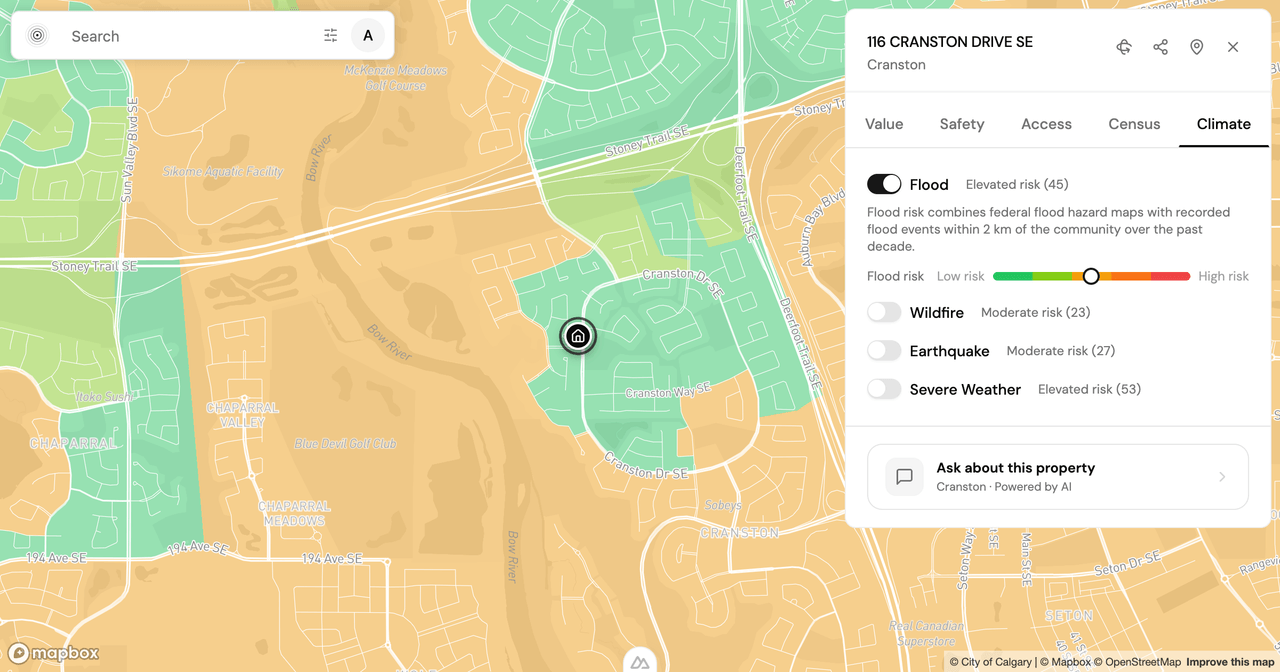
Cranston's canonical neighbourhood climate resilience score is 72.86 out of 100, and its flood resilience sub-score is 54.72, in the live pull on 2026-09-29. Lower means higher modelled exposure. Severe weather is weaker still at 47.43, so flood is worth opening for a river-adjacent lot without treating it as the community's only climate concern. These are area-weighted neighbourhood figures; they do not rate an individual property. Explore displays the opposite risk framing, rounded: flood risk of 45 corresponds to flood resilience of 54.72.
Cranston's climate page gives a neighbourhood summary. For the detailed flood row, generate an Analyze report for the community or your shortlisted address. Two neighbourhoods can share the same composite while one carries higher flood risk and another higher radon, and those are different decisions.
What to Look for in the Flood Layer
Inside an Analyze report's per-hazard breakdown, the flood row gives you three things worth reading in order.
First, the flood sub-score, on the same 0-to-100 scale, where a lower number means higher modelled susceptibility. Read it as a flag for closer inspection, not a property-level verdict.
Then, the historical context behind the model. Recorded flood events contribute to the susceptibility measure, but the score does not establish whether the specific lot flooded in 2013. Check municipal flood records for that address.
Finally, check the resolution and limits. The national susceptibility raster describes the dissemination area, and the neighbourhood summary averages across those areas. It cannot establish the flood-plain designation, insurance terms, or drainage of one lot.
Two limits are worth stating plainly. The score describes a neighbourhood, not your specific lot, and elevation relative to the river can change sharply from one street to the next. And the model reflects susceptibility and historical extents, not the flood mitigation the City has built since 2013 or the municipal floodway and flood-fringe maps. Read the climate lens to decide where to look closer, then check the City of Calgary's flood maps for the exact address.
Cranston and Auburn Bay, Side by Side
Cranston is not the only southeast community near the Bow that buyers weigh, so it helps to put it next to Auburn Bay, which shares the same broad geography but a different value and access profile.
| Measure (2026) | Cranston | Auburn Bay |
|---|---|---|
| Median assessed value | $643,000 | $451,750 |
| 5-year value growth | 43.2% | 44.0% |
| Year-over-year value | -1.0% | -2.0% |
| Accessibility score (out of 100) | 16 | 29 |
| Groceries on foot in 15 min | 1 | 2 |
| Owner-occupied | 88.0% | 75.3% |
| Median age | 37 | 34 |
The two communities grew at almost the same five-year pace, yet Cranston's median assessed value sits close to $191,000 higher, and Auburn Bay reaches one more grocery on foot. Neither of those tells you which one floods less. For that, compare the flood rows in Analyze reports for each community. Auburn Bay's climate page is a starting summary, because two neighbours in the same river valley can still carry different modelled susceptibility.
Reading Climate Alongside the Value Trend
The last step is to stop reading the climate score in isolation. Cranston's assessed value is up 43.2% over five years and down 1.0% in the latest year, so the recent trend is a slight cooling on top of strong medium-term growth. If the flood sub-score flags higher susceptibility, that is not a reason on its own to walk away from a neighbourhood that has held its value. It is a reason to price flood insurance early, ask the seller for any past claims, and confirm the address against the municipal flood maps before your conditions come off.
This is where the per-hazard breakdown earns its place. Every Analyze report includes a climate breakdown, so you can read the flood row next to the value trend and the accessibility profile in one place. New accounts are permanently free; see the Decision Pass and Professional plan on the pricing page for report access across a search. To see the breakdown for the exact lot you are considering, run a report for a specific Cranston address. For the wider southeast context, the Calgary hub links every community's lens pages.
The climate lens will not tell you that a house is safe or unsafe from flooding. It will tell you where the modelled risk is higher, so the question you take into a showing is sharper than "is Cranston a flood zone?" I'd love to hear how you are weighing climate risk in your own search, so please reach out if you have questions or if there is a community you would like to see broken down next.
Sources
- Climate hazard scores: national hazard datasets including NRCan flood susceptibility and historical events, Health Canada radon data, and Ouranos PAVICS heat data. The canonical composite and hazard breakdown are area-weighted neighbourhood resilience scores. Flood uses current susceptibility and historical events.
- Property values: City of Calgary 2026 assessment roll, aggregated by community.
- Demographics: Statistics Canada, 2021 Census, aggregated to community polygons.
- Flood maps and mitigation for a specific address: the City of Calgary's published flood maps.
Keep reading

Is Highland Park Calgary Safe? Reading the Inner-North Crime Data
Is Highland Park Calgary safe? We pulled the Calgary Police crime data for this inner-north community and read a safety score of 49 category by category.

Is Oakwood Village Toronto Safe? What the Crime Data Shows
Is Oakwood Village Toronto safe? We read the Toronto Police crime data by category and trend to show how to turn a safety score into a question you can act on.
Is Pelmo Park-Humberlea Safe? How to Read Northwest Toronto's Crime Data Before You Buy
Is Pelmo Park-Humberlea safe? We read Toronto's 2025 crime data by category and trend to show how to weigh a northwest Toronto safety score before you buy.
See where the data comes from
Every source, and the four rungs between a public record and a sentence about your life, each with what it cannot tell you.
See where the data comes from