What Edmonton's Census Data Shows About South-End Family Neighbourhoods
Data freshness: Figures checked against the live PickYourPlace database on 2026-09-29. Property values use the City of Edmonton 2026 assessment roll; demographics use the Statistics Canada 2021 Census. Wîhkwêntôwin is the current name of the neighbourhood formerly called Oliver.
When you tour a new-build in south Edmonton, the things that sell you are the things you can see: the finish on the kitchen island, the width of the lot, the show-home landscaping. What you cannot see is who your neighbours will be, whether most people own or rent, and how far you will drive for a carton of milk. Census data answers those questions, and it often matters more to daily life than curb appeal does.
The new neighbourhoods in south Edmonton can look almost identical from the road. In this post, I will walk through what the census and demographics data shows for three Edmonton communities (Keswick Area and Chappelle Area in the south end, and Wîhkwêntôwin (formerly Oliver) in the inner city as a contrast) and how to read those numbers before you write an offer. All three are covered in PickYourPlace's Edmonton data.
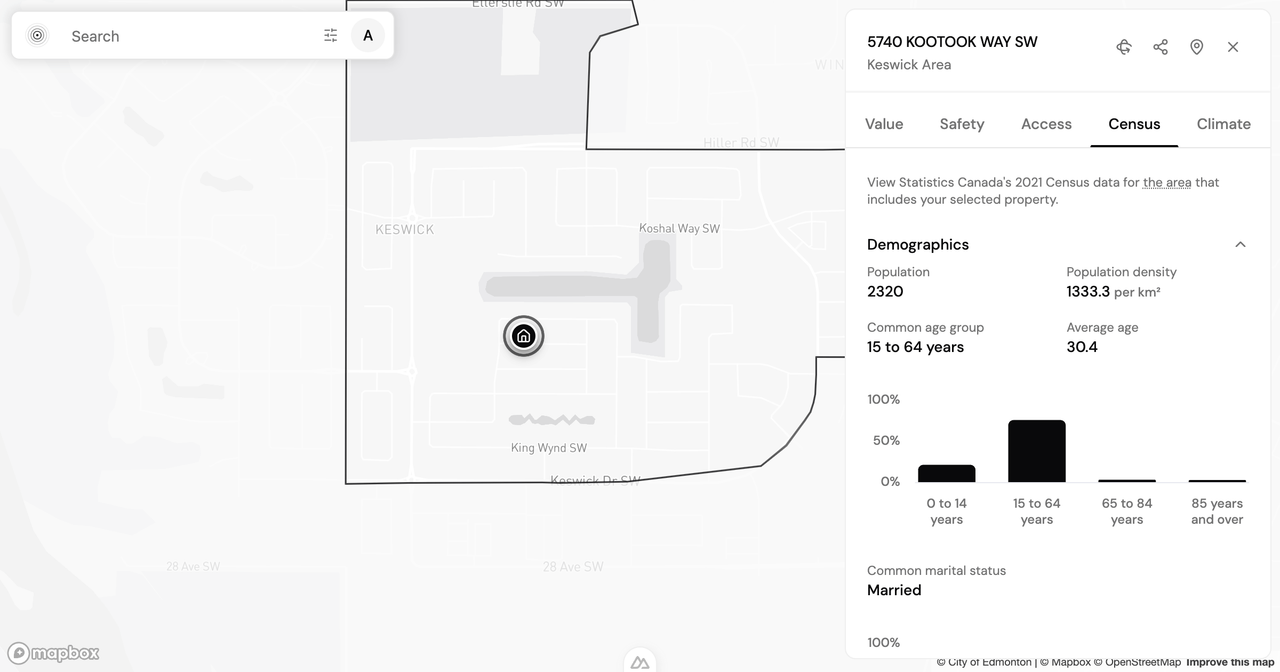
One definition first. PickYourPlace draws demographics from Statistics Canada's census, reported at the dissemination area, the smallest geographic unit for which Statistics Canada releases the full set of census data, roughly a few hundred households. In the Census lens you see household size, the split between owners and renters (what we call tenure), and average age, put in context against the rest of the city.
Keswick Area by the numbers
Keswick Area sits at the southwest edge of the city, and its census profile reads like a family suburb. 74.5% of households own their home and 25.3% rent, the average household holds 2.8 people, and the median age is 33, consistent with a neighbourhood of families with young children. The median assessed value is $575,500, up 22.6% over five years and 3.0% in the past year.
The number that should give a buyer pause is access. Keswick scores 4 out of 100 on the Accessibility lens, a weighted blend of access to everyday destinations and transit, near the bottom of the scale. The separate community walking-reach measure records zero grocery and food options within a 15-minute walk from its reference point. Individual addresses can differ. For a household with two working adults and kids, that means the car does the work for every errand. Its Safety score is 66.
Chappelle Area, a similar family, a different trajectory
Chappelle Area, a little to the east, has almost the same demographic shape: 76.0% owners, 24.0% renters, an average household of 2.9, and a median age of 31. If you are choosing between the two on who lives here, the census barely tells them apart.
The data starts to diverge on value and access. Chappelle's median assessed value is $474,000, about $100,000 below Keswick, but it has grown faster, up 25.3% over five years and 4.0% in the past year. Its Accessibility score is 13, still low but higher than Keswick's 4, and you can reach two grocery stores on a 15-minute walk rather than none. Its Safety score is 63. Neither community is the "right" one; they trade a lower entry price and a slightly shorter walk to essentials (Chappelle) against a higher current value (Keswick).
Wîhkwêntôwin, the inner-city trade-off
To see how much a neighbourhood's demographics shape everything else, compare either south-end community with Wîhkwêntôwin, just west of downtown. Wîhkwêntôwin's census profile is close to the opposite: 27.9% own and 72.1% rent, the average household is 1.5 people, and the median age is 41. This is a neighbourhood of singles and couples in small households, not families in detached homes.
Everything downstream follows from that. The median assessed value is $118,000, consistent with a housing stock of condos and apartments rather than houses, and it has slipped 3.0% over five years, with no change in the past year. But Wîhkwêntôwin scores 82 on Accessibility, and you can reach seven grocery stores within a 15-minute walk. If you prioritize walking to daily errands, the data points one way; if you prioritize a family-sized home you own, it points the other.
Asking better questions with the census lens
The value of the census data is not that it declares a winner. It is that it turns vague questions into specific ones:
- Tenure: In a 70%-plus owner community like Keswick or Chappelle, turnover is slower and most neighbours are long-term. Is that the street life you want?
- Household size and age: An average of 2.8 to 2.9 people and a median age in the low 30s points to families with young children, which shapes schools, parks, and who you eventually sell to.
- Access versus space: An accessibility score of 4 is not a flaw, it is a trade-off. It tells you the true cost of a bigger, newer home partly in drive time.
How to run the numbers on any Edmonton community
You can pull this same breakdown for any address or community yourself:
- Open the Explore map and search an Edmonton address or neighbourhood.
- Switch to the Census lens to read household size, tenure, and average age for that dissemination area.
- Run a full report in Analyze to combine demographics with value, safety, accessibility, and climate in one place, personalized to what you care about. Check the pricing page for current report access.
Census data will not tell you which house to buy. It will tell you what kind of place you are buying into, so the decision is yours to make with the numbers in front of you. I would love to hear how you are using it: if there is an Edmonton community you want broken down, or a metric you wish we scored, reach out and let me know.
Keep reading

Is Highland Park Calgary Safe? Reading the Inner-North Crime Data
Is Highland Park Calgary safe? We pulled the Calgary Police crime data for this inner-north community and read a safety score of 49 category by category.

Is Oakwood Village Toronto Safe? What the Crime Data Shows
Is Oakwood Village Toronto safe? We read the Toronto Police crime data by category and trend to show how to turn a safety score into a question you can act on.
Is Pelmo Park-Humberlea Safe? How to Read Northwest Toronto's Crime Data Before You Buy
Is Pelmo Park-Humberlea safe? We read Toronto's 2025 crime data by category and trend to show how to weigh a northwest Toronto safety score before you buy.
See where the data comes from
Every source, and the four rungs between a public record and a sentence about your life, each with what it cannot tell you.
See where the data comes from