Is Bowness Calgary Safe? Reading the Safety Data for 3 NW Communities
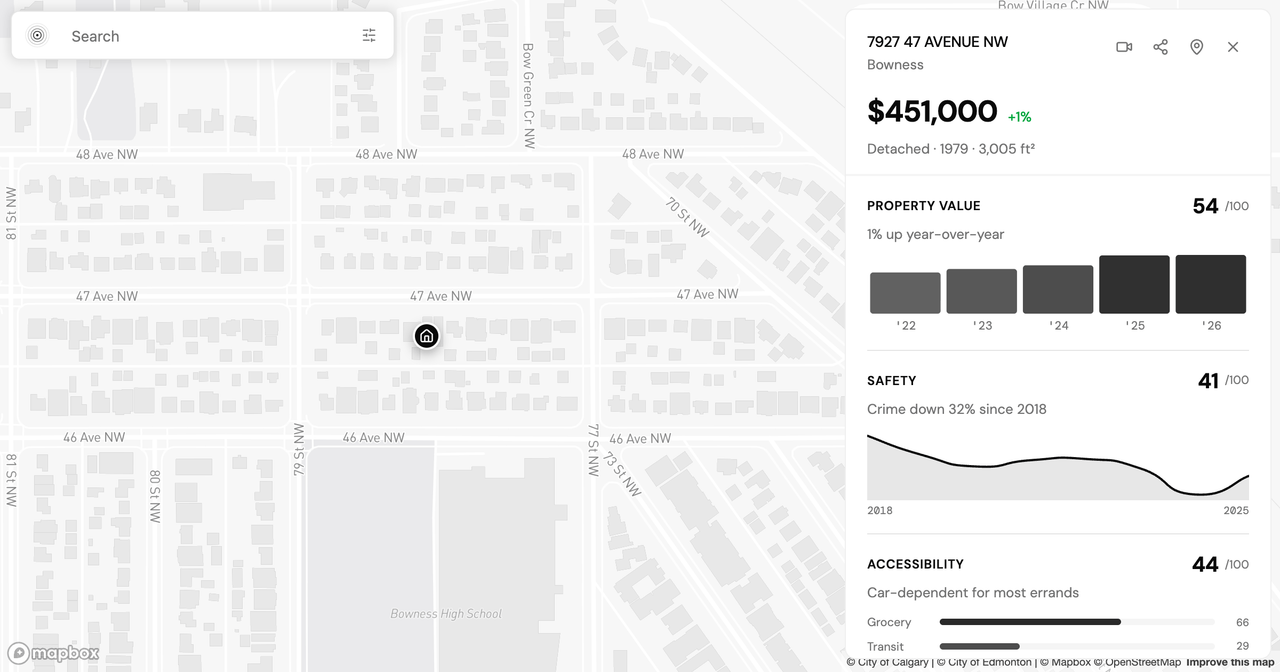
Data freshness: Calgary Police Service community crime statistics through year-end 2025. Property values from the City of Calgary 2026 assessment roll. Every neighbourhood figure below is pulled live from the PickYourPlace database, last refreshed 2026-07-13. See the Methodology section for sources.
When people research a Calgary neighbourhood before making an offer, safety is usually the first thing they type into a search bar. "Is Bowness Calgary safe?" is a specific version of a question buyers ask about every community they shortlist, and the answers that come back are mostly anecdotes: a Reddit thread from three years ago, a comment from a friend of a friend, a single story that stuck. Anecdotes are memorable, but they are not evidence, and they rarely tell you which risk is actually rising on your block.
Bowness, Tuxedo Park, and Banff Trail sit in Calgary's inner northwest, close enough that people often lump them together, yet the crime data reads differently in each one. In this post, I will walk through what the 2025 Calgary Police Service numbers show for all three communities (the volume, the category breakdown, and the year-over-year trend) and then explain how to read a safety score as a starting point for your own check rather than a verdict on the place.
Why the Northwest Reads Differently Block by Block
The inner northwest is not one housing market. Bowness runs along the Bow River on the city's western edge, a low-density community with an older detached-home stock. Tuxedo Park and Banff Trail sit closer to the centre along the north CTrain corridor, denser and more transit-connected. Density, commercial strips, and proximity to a train line all change what gets reported and where, which is why a single "northwest is safe/unsafe" claim falls apart the moment you look at the numbers.
Two definitions before the breakdowns. A rate per 1,000 residents divides reported incidents by population, so you can compare a large community to a small one fairly. A percentile ranks a community against every other one in the same city. The 84th percentile for crime volume means more reported incidents than about 84% of Calgary communities. PickYourPlace's Safety lens on the Explore map turns Calgary Police counts, plus street lighting, traffic, noise, and emergency-service proximity, into a single 0-to-100 composite safety score, with crime weighted most heavily at 30% of the blend.
Is Bowness Calgary Safe? What 335 Incidents in 2025 Show
Bowness recorded 335 reported incidents in 2025, a rate of 30.1 per 1,000 residents. That places it in the 84th percentile for crime volume citywide, higher than most Calgary communities, while its composite safety score, which credits strong emergency-service access, is 41 out of 100, a little below the Calgary median score of about 48. The two readings point in different directions, and both are true.
The category mix is where the useful signal sits:
- Theft from vehicle (items taken from inside a car) is the largest category at 74 incidents, 6.6 per 1,000, and it rose 42.5% year over year.
- Assault follows at 65 incidents, 5.8 per 1,000, and it fell 22.6% over the same period.
- Theft of vehicle (the car itself taken) sits at 63 incidents, 5.7 per 1,000, up 53.5% year over year.
All reported crime in Bowness rose 28.4% in 2025, and the two vehicle categories account for most of that increase. That is a specific, largely behaviour-mitigable risk (where and how a car is parked) rather than a broad rise in violence, which actually declined. The full Bowness safety breakdown shows each category against the citywide rate.
Tuxedo Park: A Declining Trend and One Category Spike
Tuxedo Park recorded 115 incidents in 2025, 21.6 per 1,000 residents, in the 71st percentile for crime volume, with a composite safety score of 49, essentially the Calgary median score of about 48. Its overall trend is down 5.7% year over year, the opposite direction from Bowness.
One category runs against that calm headline. Break and enter (commercial), a break-in at a business rather than a home, jumped 225.3% to 26 incidents, 4.9 per 1,000. Theft from vehicle, by contrast, fell 27.3% to 24 incidents, and assault dropped 33.4% to 22 incidents. So the reassuring overall trend and the one sharp spike are both real, and they describe different things: residential-facing risk easing while a commercial-premises category climbs. If you are looking at a home near Tuxedo Park's retail strips, that is the line worth examining more closely on the Tuxedo Park safety page. Transit access here sits in the 90th percentile citywide, one reason the community draws buyers who want to stay car-light.
Banff Trail: 102 Incidents and a Large Assault Drop
Banff Trail recorded 102 incidents in 2025, 24.6 per 1,000 residents, in the 76th percentile for crime volume, with a composite safety score of 43. All reported crime fell 12.7% year over year, the steepest decline of the three.
Its category profile is heavily weighted toward one type. Theft from vehicle dominates at 45 incidents, 10.8 per 1,000, up a modest 4.7%. Assault fell sharply, down 45.8% to 13 incidents, 3.1 per 1,000. Break and enter (commercial) is small at 8 incidents but rose 34.0%. A community where the leading category is theft from vehicles, and where violent incidents dropped by nearly half in a year, is a different lived experience than the raw incident count alone suggests, which is exactly why the Banff Trail safety data is worth reading category by category rather than as a single number.
Reading a Safety Score as a Door, Not a Verdict
Across all three communities, the composite safety score lands between 41 and 49, clustered around the Calgary median score of about 48, which a headline would flatten into "average." The category detail underneath is where the communities actually differ: Bowness with rising vehicle crime and falling assault, Tuxedo Park with a commercial break-in spike against an easing overall trend, Banff Trail with a theft-from-vehicle concentration and a steep assault decline.
That is the case for treating a score as a door rather than a grade. A score tells you where to look next: which category, which direction it is moving, whether the risk is aimed at cars, businesses, or people. It does not tell you whether a place is right for you, and it cannot see everything.
Here is what these numbers leave out:
- Unreported incidents, a known gap in all crime statistics, especially for low-level theft and vandalism.
- Block-level variation: the data is community-level, but you buy on a specific street.
- Time-of-day patterns, which annual totals flatten completely.
- Perceived safety, how a walk home at night actually feels, which no dataset captures.
Run Your Own Safety Check
The most reliable way to answer "is this neighbourhood safe for me?" is to read the data for the specific address you are considering, not the community average. Two ways to do that:
- Open the Safety lens on the Explore map and compare any of these communities side by side. The scores are free with no signup; toggling the crime categories underneath them is part of the free 7-day trial and the paid plans.
- For a full written breakdown across all five lenses (Value, Safety, Accessibility, Census, and Climate), an Analyze report generates an address-level analysis that puts the crime categories, trends, and emergency-access context together in one place. See what each plan includes on the pricing page.
Methodology and Sources
- Crime data: Calgary Police Service community-level incident statistics, pulled live from the PickYourPlace database, with 2025 as the most recent complete year and year-over-year change measured against 2024.
- Safety composite: PickYourPlace 0-to-100 safety score, blended from percentile-ranked components: reported crime (weighted 30%), traffic, street lighting, noise, and proximity to police, fire, and health services.
- Property values: City of Calgary 2026 assessment roll, aggregated by community. Bowness carries a median assessed value of $581,000 (five-year growth 52.9%), Tuxedo Park $649,000 (38.2%), and Banff Trail $818,250 (33.6%).
- Percentiles rank each community against all Calgary communities for the stated year.
Numbers describe a neighbourhood; they do not decide for you. If you prioritize riverside space and a detached-home stock, Bowness's trade-offs may fit, with vehicle theft as the risk to plan around; if transit access ranks higher for you, Tuxedo Park's 90th-percentile transit reading is worth weighing against its commercial break-in trend. I would love to hear how you read this data for your own shortlist. Reach out if you have questions or a community you would like to see broken down next.
Keep reading

Is Highland Park Calgary Safe? Reading the Inner-North Crime Data
Is Highland Park Calgary safe? We pulled the Calgary Police crime data for this inner-north community and read a safety score of 49 category by category.

Is Oakwood Village Toronto Safe? What the Crime Data Shows
Is Oakwood Village Toronto safe? We read the Toronto Police crime data by category and trend to show how to turn a safety score into a question you can act on.
Allendale vs Windermere: Two Edmonton Neighbourhoods, Side by Side
Allendale vs Windermere in Edmonton: two communities at nearly the same assessed value that split on transit, safety, and who lives there. What the data shows.
Check a neighbourhood
Every neighbourhood has a page with its safety rank, what that rank measures and what it cannot tell you. Free, and no account.
Check a neighbourhood