Is Dufferin Grove Safe? What Toronto's Crime Data Shows
Data freshness: Toronto Police Service reported-crime statistics through year-end 2025, sourced via the City of Toronto open data portal. Population and demographics from the Statistics Canada 2021 Census. Every neighbourhood figure below is pulled from the PickYourPlace database. See the sources note at the end.
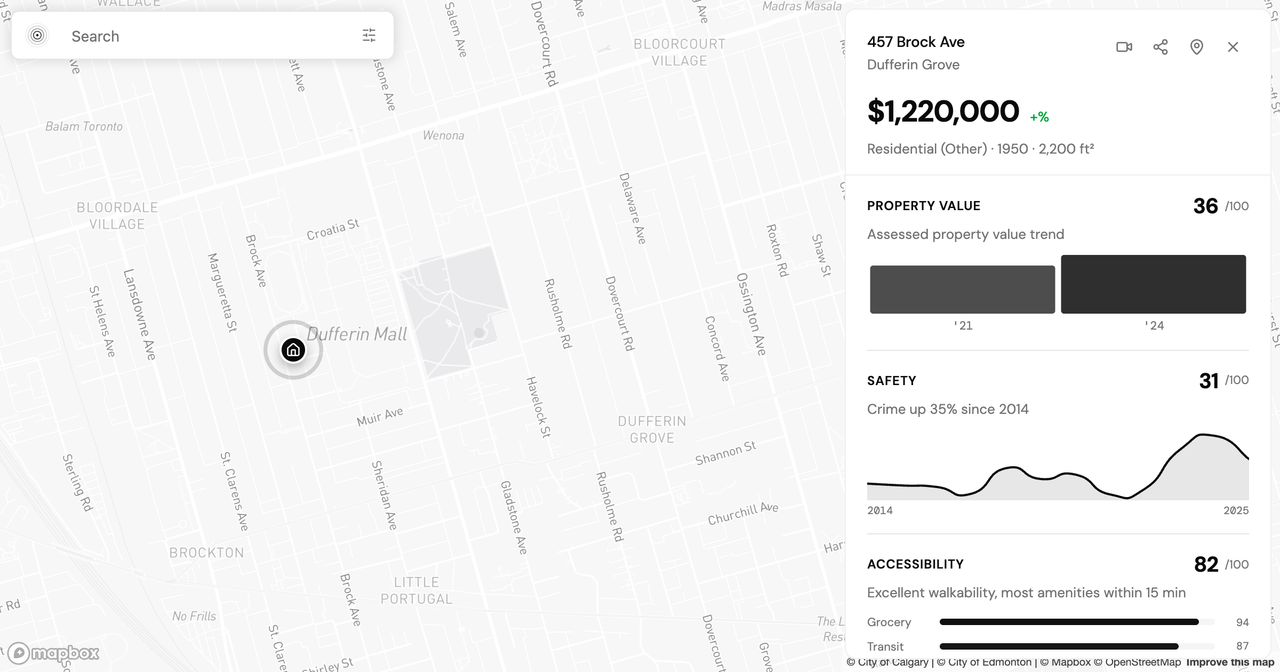
If you are looking at a place in Dufferin Grove, one of the first questions you will ask is the plainest one: how safe is it, really? Dufferin Grove is a small central Toronto neighbourhood west of the downtown core, wrapped around its namesake park between Bloor Street and College Street. Search "dufferin grove toronto safety" and you get opinions, reputation, and very little data. Here is what the reported-crime data actually shows: Dufferin Grove scores 31 out of 100 on safety, which sounds alarming until you read what that single number is built from.
A safety score is a starting point, not a verdict. In this post, we walk through Dufferin Grove's safety score one layer at a time: what a score of 31 means and does not mean, how the crime categories break down, which way the trends are pointing, and where the numbers stop being useful. The goal is to help you decide whether the trade-off fits your priorities, not to hand you a grade.
Why a safety score needs a breakdown, not a headline
A safety score is a weighted composite, not a rank. Dufferin Grove's 31 out of 100 blends reported crime with traffic history, street lighting, access to police, fire, and health services, and ambient noise, each measured against the rest of Toronto before it is weighted in. It is not a statement that Dufferin Grove is safer than 31% of Toronto neighbourhoods. It is a low score, and it is the number most reputation-based "is it safe" answers stop at.
Stopping there hides the tension that makes Dufferin Grove what it is. The same neighbourhood that scores low on the composite safety lens scores 82 out of 100 for accessibility and 87 for transit, among the most connected places in the city. Density and central location drive both readings at once: more people, more foot traffic, and more reported incidents per square kilometre, alongside frequent transit and short distances to almost everything. One score cannot hold both facts, which is why the breakdown matters more than the headline.
Dufferin Grove at a glance: what a safety score of 31 means
Here are the four figures that anchor the rest of this post. The crime figures are for 2025; the lens scores are current composites:
- Safety score: 31 out of 100. Low on the composite, for the reasons above.
- Reported crime volume: 87th percentile citywide, at 227 incidents, or 18.0 per 1,000 residents. On volume alone, Dufferin Grove reports more per resident than most Toronto neighbourhoods.
- All-crime trend: down 19.2% year over year. The volume is high, but it fell sharply in the most recent complete year rather than climbing.
- Accessibility score: 82 out of 100, with transit at 87. This is the counterweight the composite safety number does not show.
The picture is a busy, well-connected central neighbourhood that reports a lot of crime and saw that crime drop meaningfully in the latest year. Whether that is the right trade-off is a question the categories answer better than the composite does.
Reading the crime categories: assault, theft, and break-ins
The type of crime being reported shapes daily life far more than the total. A neighbourhood whose incidents are mostly theft from parked cars is a different lived experience than one weighted toward violent incidents. Dufferin Grove's three largest categories among its 227 reported incidents in 2025 look like this:
- Assault: 154 incidents (12.2 per 1,000, down 15.5% year over year). Assault is the largest category by a wide margin and the main reason the overall count is high. Reassuringly, it fell in the latest year. Assault in police reporting covers a broad range of severity, from threats to serious harm, so the count alone does not describe how severe the typical incident is.
- Theft from motor vehicle: 35 incidents (2.8 per 1,000, up 17.1% year over year). The smallest of the three by count, but the only one rising. If you keep a car here, this is the risk the data points at most directly, and the one most within your control through where and how you park.
- Break and enter: 34 incidents (2.7 per 1,000, down 28.9% year over year). Break-ins into homes and businesses fell the most of any category. For a central neighbourhood, a declining break-and-enter rate is the figure a buyer or renter living there tends to care about most.
Two of the three largest categories are falling, and the one that is rising is property crime against vehicles rather than against people or homes. That is a more useful reading than "a safety score of 31, avoid."
How Dufferin Grove sits in central Toronto
Central Toronto neighbourhoods tend to cluster the same way Dufferin Grove does: strong on accessibility, lower on the composite safety lens, because density raises reported-incident counts and shortens distances at the same time. Dufferin Grove's accessibility score of 82 and transit score of 87 place it among the better-connected neighbourhoods in the city, and its high crime-volume percentile is a pattern it shares with much of the core rather than an outlier within it.
Comparing specific neighbours is worth doing with the actual numbers rather than reputation, and that is exactly what the Dufferin Grove safety page and the Safety lens on the Explore map are for. Toggle the crime categories and read any two central Toronto neighbourhoods side by side. If you are moving into the city rather than within it, our relocation view frames the same data around what changes when you arrive somewhere new.
What the safety data does not capture
The numbers describe reported crime. They do not describe everything that shapes how safe a place feels, and it is worth being explicit about the gaps:
- Perceived safety, how safe you feel walking home late on a quiet street, is not in any of these figures.
- Unreported incidents are a known gap in all crime statistics, especially for low-level theft, harassment, and vandalism.
- Time-of-day and block-level patterns are flattened by annual, neighbourhood-level totals; a park edge at 2 AM and a residential street at 3 PM read as one number.
- Daytime population matters here. Per-1,000 rates use residents as the denominator, but a central neighbourhood near transit absorbs a large daytime and commuter population that is not counted, which can make per-resident rates read higher than any one resident's actual exposure.
Numbers describe; they do not decide. If you prioritize transit and central access, Dufferin Grove's trade-off may work well for you, with vehicle theft as the risk to plan around. If a high reported-crime count is a dealbreaker regardless of what it is made of, the same data points you toward quieter, less central neighbourhoods, with a longer commute as the cost.
For context on who lives there: the 2021 Census puts Dufferin Grove's median age at 39, average household size at 2.2, and tenure at roughly 41% owner-occupied to 59% renter. It is a renter-leaning neighbourhood, which for a buyer can mean more building turnover but also steady rental demand if you ever need to lease a unit.
From the safety page to a full report
The Dufferin Grove safety page is public and free, and it is the fastest way to see these figures on a map. To take the analysis to a specific address, the Analyze report runs the full pipeline across all five PickYourPlace lenses (Value, Safety, Accessibility, Census, and Climate) for the exact place you are considering, because two units a block apart can read very differently even when the neighbourhood score is identical.
You can generate a report for a specific Dufferin Grove address on a 7-day free trial, no credit card required, and see the plans and limits if you want to keep running reports after that.
Safety is one lens of five, and a score is a door, not a verdict. If there is a Toronto neighbourhood you would like us to read next, or a figure here you want to dig into, I would love to hear from you. Reach out and let us know.
Sources. Reported-crime figures: Toronto Police Service statistics via the City of Toronto open data portal, 2025 as the most recent complete year, with year-over-year change measured against 2024. Safety and accessibility scores: PickYourPlace lens scores out of 100 across Toronto neighbourhoods, each a weighted blend of percentile-ranked components. Population and demographics: Statistics Canada, 2021 Census.
Keep reading

Is Highland Park Calgary Safe? Reading the Inner-North Crime Data
Is Highland Park Calgary safe? We pulled the Calgary Police crime data for this inner-north community and read a safety score of 49 category by category.

Is Oakwood Village Toronto Safe? What the Crime Data Shows
Is Oakwood Village Toronto safe? We read the Toronto Police crime data by category and trend to show how to turn a safety score into a question you can act on.
Allendale vs Windermere: Two Edmonton Neighbourhoods, Side by Side
Allendale vs Windermere in Edmonton: two communities at nearly the same assessed value that split on transit, safety, and who lives there. What the data shows.
Check a neighbourhood
Every neighbourhood has a page with its safety rank, what that rank measures and what it cannot tell you. Free, and no account.
Check a neighbourhood