Is Scarborough Village Toronto Safe? What the Crime Data Actually Shows
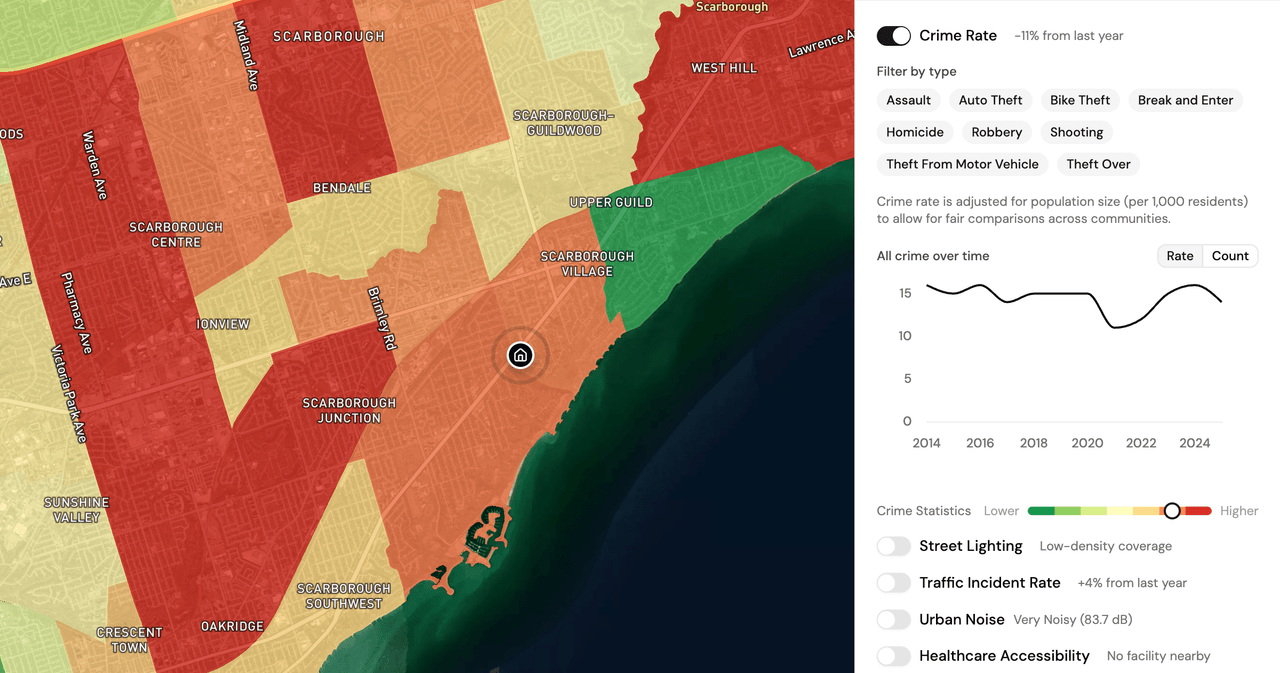
Data freshness: Toronto Police Service community-level crime statistics through year-end 2025, pulled live from the PickYourPlace database on 2026-07-27. Population and demographics from the Statistics Canada 2021 Census. Every neighbourhood figure below comes from that same pull. See the note at the end for what these numbers do and don't cover.
You've found a house in Scarborough Village that fits your budget, which in east Toronto is not a small thing on an $800,000 decision. Then you open a Reddit thread, read three contradictory comments about whether the area is "rough," and end up more uncertain than when you started. Anecdote is loud, and it rarely agrees with itself.
So here is the more useful question: what does the actual crime data show, and how should you read it before you make an offer?
A safety score is a door, not a verdict
PickYourPlace scores every Toronto community for safety on a 0-to-100 percentile scale, blended from reported crime, plus factors like traffic and proximity to emergency services. Scarborough Village sits in the 26th percentile citywide. Read on its own, that number invites a snap judgment.
Treat it instead as a door. A percentile in the twenties tells you to look closer at which crimes, which direction they are trending, and how they land on daily life. It does not tell you to walk away, and it certainly does not tell you the block you are looking at plays out the way the community average does. The score is where the reading starts, not where it ends.
What Scarborough Village's 2025 numbers show
Scarborough Village recorded 267 reported incidents in 2025, which works out to 14.3 per 1,000 residents. Rate per 1,000 matters more than the raw count here, because it accounts for how many people live in the community and lets you compare it to anywhere else in the city on the same footing.
The trend is the part most reputation-based takes miss. All-crime incidents in Scarborough Village fell 10.8% year over year. So the community carries an above-average incident rate, and that rate is moving down, not up. A single score flattens those two facts into one; the direction of travel is often the more decision-relevant of the two.
The category mix changes the read
A neighbourhood with a lot of car break-ins is a different lived experience than one with a lot of assaults, even at the same total count. Scarborough Village's three largest categories pull in different directions:
- Assault: 143 incidents, 7.6 per 1,000, down 9.3% year over year. This is the largest single category and the one that most shapes how a place feels day to day. It is elevated relative to the city, and it is trending down.
- Theft from motor vehicle: 56 incidents, 3.0 per 1,000, up 12.2%. The one category rising meaningfully. If you park on the street, this is the risk the data points at most directly, and it is largely the kind you can plan around through where and how you park.
- Auto theft: 52 incidents, 2.8 per 1,000, down 24.5%. Auto theft has been a Greater Toronto Area story for a few years, so a drop this sharp in one community is worth noticing rather than assuming.
Those three categories do not sum to the full 267; the rest is spread across smaller categories. The point of the breakdown is not to tally it back up. It is that "is it safe" resolves into several different questions, and the data answers them separately.
Same 267 incidents, a very different neighbourhood
To see why the raw count can mislead, compare Scarborough Village to Islington, in Etobicoke. Islington recorded the same 267 incidents in 2025. On a headline count, the two look identical.
They are not. Islington's lower residential density puts its rate at 9.5 per 1,000, against Scarborough Village's 14.3. And its trend is steeper: all-crime down 24.2% year over year, more than double the decline in Scarborough Village. Category by category, the gap holds: assault at 3.9 per 1,000 (down 21.4%), break and enter at 2.9 per 1,000 (down 13.8%), auto theft at 1.7 per 1,000 (down 44.9%).
Those two differences, the lower rate and the faster decline, are most of why Islington lands in the 62nd percentile while Scarborough Village lands in the 26th. Same incident count, a 36-percentile gap in the score. If you were comparing these two communities on the number in a news headline, you would miss the entire story.
This is also a caution against ranking neighbourhoods off a single figure. The honest comparison is conditional: if a lower incident rate and a faster-improving trend are what you weight most, Islington reads stronger here. That is a statement about these two data points, not a claim that one community is better to live in than the other.
How to open the safety lens for a Toronto address
Community averages are one layer. The block is another, and they can diverge. To go deeper on either community, open the safety lens directly:
- The safety lens for Scarborough Village breaks the score into its components and shows each crime category and its trend, the same figures used above.
- The safety lens for Islington does the same, so you can hold the two side by side rather than trusting a summary of them.
- To see how the crime categories, trends, and emergency-service factors are assembled into a score, read how the safety data is built.
Start with the category with the highest rate, then check its trend direction. A high number that is falling and a low number that is climbing are two different situations, and the order you read them in changes the conclusion.
Safety is rarely the only lens that decides a purchase. Scarborough Village skews slightly toward renters, at 55.0% renter by the 2021 Census, and puts 16 grocery stores within a 15-minute walk, both facts you would weigh alongside the crime picture rather than after it. The Explore map lets you toggle those layers across the city.
From a score to a full picture
A percentile is a fast way to know where a community stands and where to look next. It is not the analysis. When you have a specific Scarborough Village address in mind, an Analyze report pulls the safety breakdown together with property value, accessibility, and census data for that address, so the safety reading sits next to the other things an $800,000 decision turns on.
The data will not make the call for you, and it should not. What it does is replace a contradictory Reddit thread with the actual numbers, their direction, and their limits, so you decide with the real picture in front of you.
What the data doesn't capture
Reported crime is a strong signal, but it is one signal. It does not include unreported incidents, a known gap for low-level theft and harassment. It flattens time-of-day and block-level variation into an annual community total, so a quiet street and a busier one share a score. And per-1,000 rates use residential population, which can read differently for communities that draw a large daytime or through population. Numbers describe a place. They do not decide it for you.
Keep reading

Who Lives in Dunbar-Southlands, Vancouver? A Census and Property-Value Read
Who lives in Dunbar-Southlands, Vancouver? We read the census profile against the 2026 assessment roll to show buyers what the numbers say.

Moving From Toronto to Calgary: Where to Live
Moving from Toronto to Calgary and unsure where to live? See how Ask turns plain-language questions into live neighbourhood data, then try it free.
Cost of Living in Calgary vs Toronto for Families: A Neighbourhood-Level Comparison
A neighbourhood-level look at cost of living for families weighing Calgary against Toronto, using census dwelling values, shelter costs, income, tenure, and walk-isochrone data.
Check a neighbourhood
Every neighbourhood has a page with its safety rank, what that rank measures and what it cannot tell you. Free, and no account.
Check a neighbourhood