South Parkdale, Toronto: What the Neighbourhood Data Shows Buyers Behind the Reputation
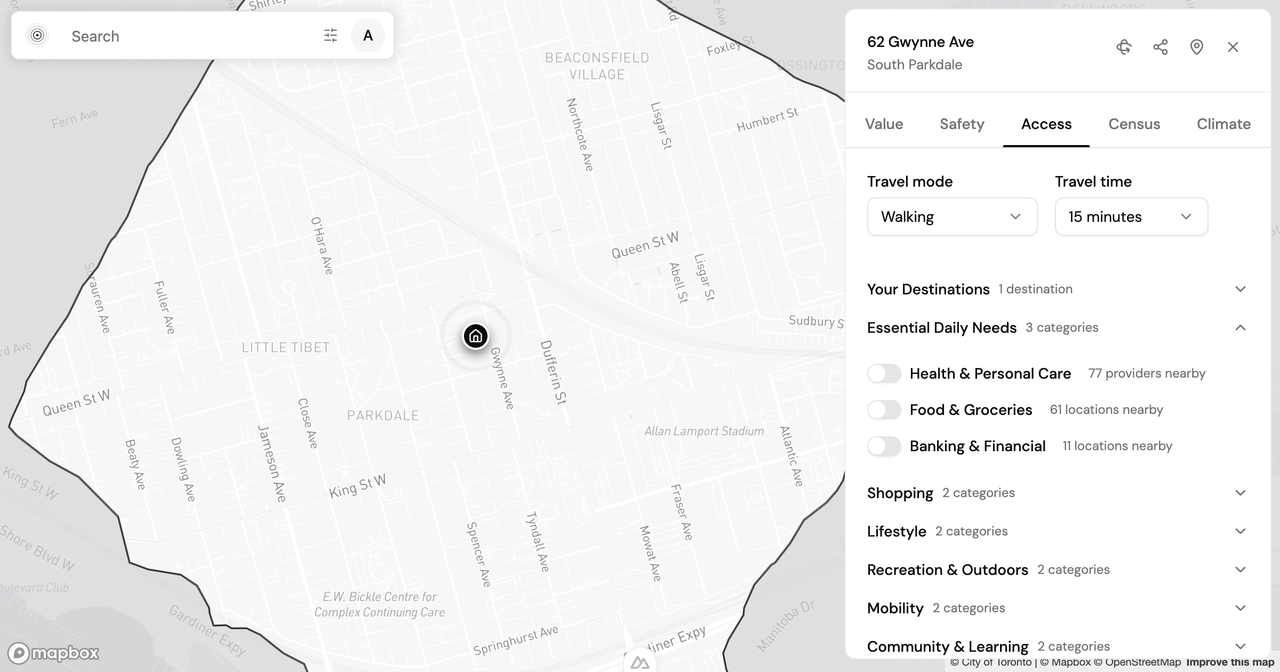
Data freshness: Every South Parkdale figure below comes from a live pull of the PickYourPlace database on 2026-08-17. Crime data is Toronto Police Service community-level statistics through year-end 2025. Tenure, age, and household figures are from the Statistics Canada 2021 Census. The property value is modelled, not assessed; more on that below. See the note at the end for what these numbers do and don't cover.
You've found a place in South Parkdale that fits your budget, which on a Toronto purchase is already the hard part. Then you mention the neighbourhood to a few people and get reactions that don't line up: one person who loves the streetcar and the lake, one who warns you off it, one who moved away. Reputation is loud here, and it disagrees with itself.
So here is the more useful question, the one reputation can't answer: what does the actual neighbourhood data show, and how should you read it before you make an offer? PickYourPlace scores South Parkdale on five lenses, and it reads differently on each. Every one of those scores is a door, not a verdict. They're worth opening.
Who actually lives in South Parkdale
The census profile is the first thing that surprises buyers who arrive with a fixed picture of the neighbourhood. South Parkdale is strongly renter-majority: 86.2% of households rent, and 13.6% own, by the 2021 Census. That tenure split shapes almost everything downstream, from the turnover on a given block to the mix of low-rise apartments and converted houses you'll see on a walk.
The rest of the profile fits that pattern. The median age is 40, and the average household size is 1.8 people, which points to a neighbourhood weighted toward singles and couples rather than larger families. None of this is good or bad on its own. It's context for reading the other lenses, and a reason to check whether the block you're considering matches the community average or sits at the edge of it.
What 41 options in a 15-minute walk buy you
South Parkdale scores 60 out of 100 for accessibility. A separate walking-reach measure adds practical context: 41 grocery and food options fall within a 15-minute walk of the neighbourhood's centre. For a buyer without a car, or one hoping to keep to a single one, that's the kind of density that changes daily errands from a drive to a walk.
Transit is the more measured part of the picture. South Parkdale sits in the 46th percentile citywide for transit access, close to the Toronto midpoint despite the streetcar lines that anchor its reputation. That is why transit is broken out as its own sub-score underneath the accessibility lens: strong walkable amenity density and mid-pack transit can live in the same neighbourhood, and you can see the 46 that sits inside the 60 rather than only the blended number.
How the safety picture breaks down
South Parkdale scores 35 out of 100 for safety, and the crime data underneath it rewards a closer read than a single label allows. The neighbourhood recorded 414 reported incidents in 2025, or 15.8 per 1,000 residents, which puts it in the 80th percentile citywide for crime volume. All-crime incidents moved +0.5% year over year, essentially flat.
The category mix is where a snap judgment goes wrong. Three categories carry most of the count, and they point in the same direction:
- Assault: 299 incidents, up 6.0% year over year. The largest single category and the one that most shapes how a place feels day to day.
- Break and enter: 63 incidents, up 26.7%. A smaller count, but a steep climb worth weighing if a ground-floor unit is on your list.
- Theft from motor vehicle: 54 incidents, up 40.0%. The sharpest rise of the three, and largely the kind of risk you can plan around through where and how you park.
Read together, these say the volume is high for the city and the trend is rising in the categories that are moving. That's a different situation than a high number that's falling, and the order you read it in changes the conclusion. To see how crime categories, trends, and emergency-service factors are assembled into the score, read how the safety data is built.
Why the value figure is modelled, not assessed
South Parkdale's modelled median property value is $1,464,000, and its value score is 25 out of 100. The word "modelled" is doing real work in that sentence, and it's the caveat most worth understanding.
This figure is not an MPAC assessment roll. It's derived from the Statistics Canada 2021 Census dissemination-area median, then indexed forward to a 2024 vintage using a housing price index. That method gives you a defensible city-wide comparison, which is what a within-city score needs. What it can't give you, for Toronto specifically, is a year-over-year or five-year growth series, so you won't see a trend line on this lens the way you might elsewhere. Treat the figure as a relative marker against the rest of the city, not as a valuation of any single address.
Go deeper on any South Parkdale address
Community averages are one layer. The specific address you're weighing is another, and they can diverge. To read any lens at the address level, open a full Analyze report on a South Parkdale property or on the neighbourhood as a whole, then work through the census lens and the others one at a time.
Start with the lens that carries the most weight for your situation. If walkable amenities and keeping to one car matter most, accessibility reads stronger here than the reputation suggests; if you're weighing a ground-floor unit, the break-and-enter trend is the number to sit with. If you expect to run reports across several neighbourhoods before you decide, check the Decision Pass and Professional plan for the report access you need. The data won't make the call for you. It gives you a frame for reading South Parkdale as it is, rather than as its reputation reports it.
A note on the numbers: scores and percentiles compare South Parkdale to other Toronto communities, not to a fixed standard. Crime data reflects reported incidents through year-end 2025 and does not capture unreported events or block-level variation. The property value is modelled from census and price-index data, not an assessment or an appraisal.
Keep reading

Is Highland Park Calgary Safe? Reading the Inner-North Crime Data
Is Highland Park Calgary safe? We pulled the Calgary Police crime data for this inner-north community and read a safety score of 49 category by category.

Is Oakwood Village Toronto Safe? What the Crime Data Shows
Is Oakwood Village Toronto safe? We read the Toronto Police crime data by category and trend to show how to turn a safety score into a question you can act on.
Allendale vs Windermere: Two Edmonton Neighbourhoods, Side by Side
Allendale vs Windermere in Edmonton: two communities at nearly the same assessed value that split on transit, safety, and who lives there. What the data shows.
Find my place
Say what matters to you and the whole city gets ranked against it, with what each place asks you to give up.
Find my place