Who Lives in Dunbar-Southlands, Vancouver? A Census and Property-Value Read

Data freshness: Scores, crime, and property figures pulled live from the PickYourPlace database on 17 August 2026. Household profile from the Statistics Canada 2021 census. Assessed values from the 2026 BC municipal roll. Crime from City of Vancouver open data, with 2025 as the most recent complete year. See the closing section for what these numbers do and do not cover.
Dunbar-Southlands has a settled reputation on Vancouver's west side: tree-lined streets, single-family houses, riding stables near the river, prices most buyers read once and move past. Reputation is a useful shorthand, but it is not a profile. If you are actually weighing a purchase here, the more useful question is who lives in Dunbar-Southlands now, what the assessment roll has done to values, and whether the two readings point the same way.
Here is what the census and property data show, one lens at a time, and where a quick read gets it wrong.
Who lives here, by the census
The household profile is the first thing that separates Dunbar-Southlands from the churn of an inner-city community. Owners hold 71.5% of dwellings and renters 26.6%, the median age is 44, and the average household is 2.8 people. That combination describes an established, owner-occupied community rather than a transient one: families settled in for the long term, with relatively little of the year-to-year turnover you see where renting dominates.
That matters for a buyer because tenure is one of the more stable signals a neighbourhood gives off. An owner share above 70% tends to move slowly. It tells you the community you are reading today is close to the one you would move into, which is not something you can assume in a neighbourhood mid-transition. The census lens on the Dunbar-Southlands page breaks these figures down further, scored against the Vancouver median so you can see where the community sits rather than reading each number in isolation.
What the 2026 assessment roll shows
The property picture is where the easy read runs into friction. The median assessed value on the 2026 roll is $3,144,750. Over five years, assessed value is down 3.1%, and year over year it has fallen 6.0%.
A decline of that size on a $3M community stops a buyer, so be precise about what it is: assessed value from the municipal roll, not a sold price. It reflects what the assessor models, and at the top of the detached market those models move with conditions that do not always track a specific sale. PickYourPlace does not carry sold-price data, so treat the roll as a directional signal about where values sit, not a quote on what a house will trade for.
Read on its own, a five-year slide can look like a neighbourhood losing its footing. Read against the census, it looks more like repricing at the top of the detached market than a community turning over. The tenure and age profile has not shifted toward transition; the same owner-heavy population is holding assets the assessor now values lower. Whether that is a floor or a further step down is not something the data settles, and a buyer at this price point should say so out loud rather than assume either direction. You can see the full assessment breakdown on the property-value lens.
Getting around is a car-first exercise
Accessibility is where Dunbar-Southlands reads weakest, and it is consistent with the built form. The community sits in the 23rd percentile for accessibility citywide and the 14th for transit. On the ground, three grocery and food options are reachable in a 15-minute walk from the community centre.
For daily life, that means most errands assume a car. A low walk and transit read is not a flaw in a neighbourhood built around detached houses and larger lots, but it is a real cost to weigh if you were expecting to leave the car at home for a grocery run or a commute. If a short transit trip downtown is a priority, this is the lens where Dunbar-Southlands asks you to compromise, and it is worth comparing against a more central community first.
Reading the safety numbers in context
Dunbar-Southlands sits in the 58th percentile for safety, a little above the Vancouver midpoint. In 2025 the community recorded 293 reported incidents, a rate of 12.9 per 1,000 residents, and all-crime is down 7.1% year over year.
The category breakdown is where the reading gets more specific. Theft from vehicle led at 80 incidents, down 9.0% year over year, and other theft followed at 74, down 6.3%. Both of the largest categories are falling, which is what pulls the overall trend down. The one moving the other way is assault or personal offence, at 48 incidents and up 91.8% year over year.
That last figure needs its context, not a headline. A near-doubling off a base of a few dozen incidents is a large percentage on a small absolute count, and one year is a change, not yet a trend. It is the category to watch on the next data pull rather than a verdict on the community. The safety score itself blends reported crime with factors like lighting, traffic, and emergency-service access, so it captures more than incident counts, and none of it captures what goes unreported.
Pull the full picture for any Vancouver address
Reputation gave you one sentence about Dunbar-Southlands. The census, the assessment roll, the accessibility scores, and the crime trend give you five readings that do not all point the same way, which is the honest state of most real neighbourhoods.
An Analyze report runs any Vancouver address or community through all five lenses at once and writes up where they agree and where they pull against each other, so you are not stitching the picture together from separate tabs. For a buyer comparing this community against others at the same price, running the census and value lenses side by side is exactly the read that a Decision Pass is built for. Start with the Dunbar-Southlands overview, then generate a report for the specific address you are weighing.
These numbers describe the community as the data recorded it, not the house you are buying or the year ahead. Use them to ask sharper questions, and bring the ones the data cannot answer to your agent and your inspection.
Keep reading

Is Highland Park Calgary Safe? Reading the Inner-North Crime Data
Is Highland Park Calgary safe? We pulled the Calgary Police crime data for this inner-north community and read a safety score of 49 category by category.

Is Oakwood Village Toronto Safe? What the Crime Data Shows
Is Oakwood Village Toronto safe? We read the Toronto Police crime data by category and trend to show how to turn a safety score into a question you can act on.
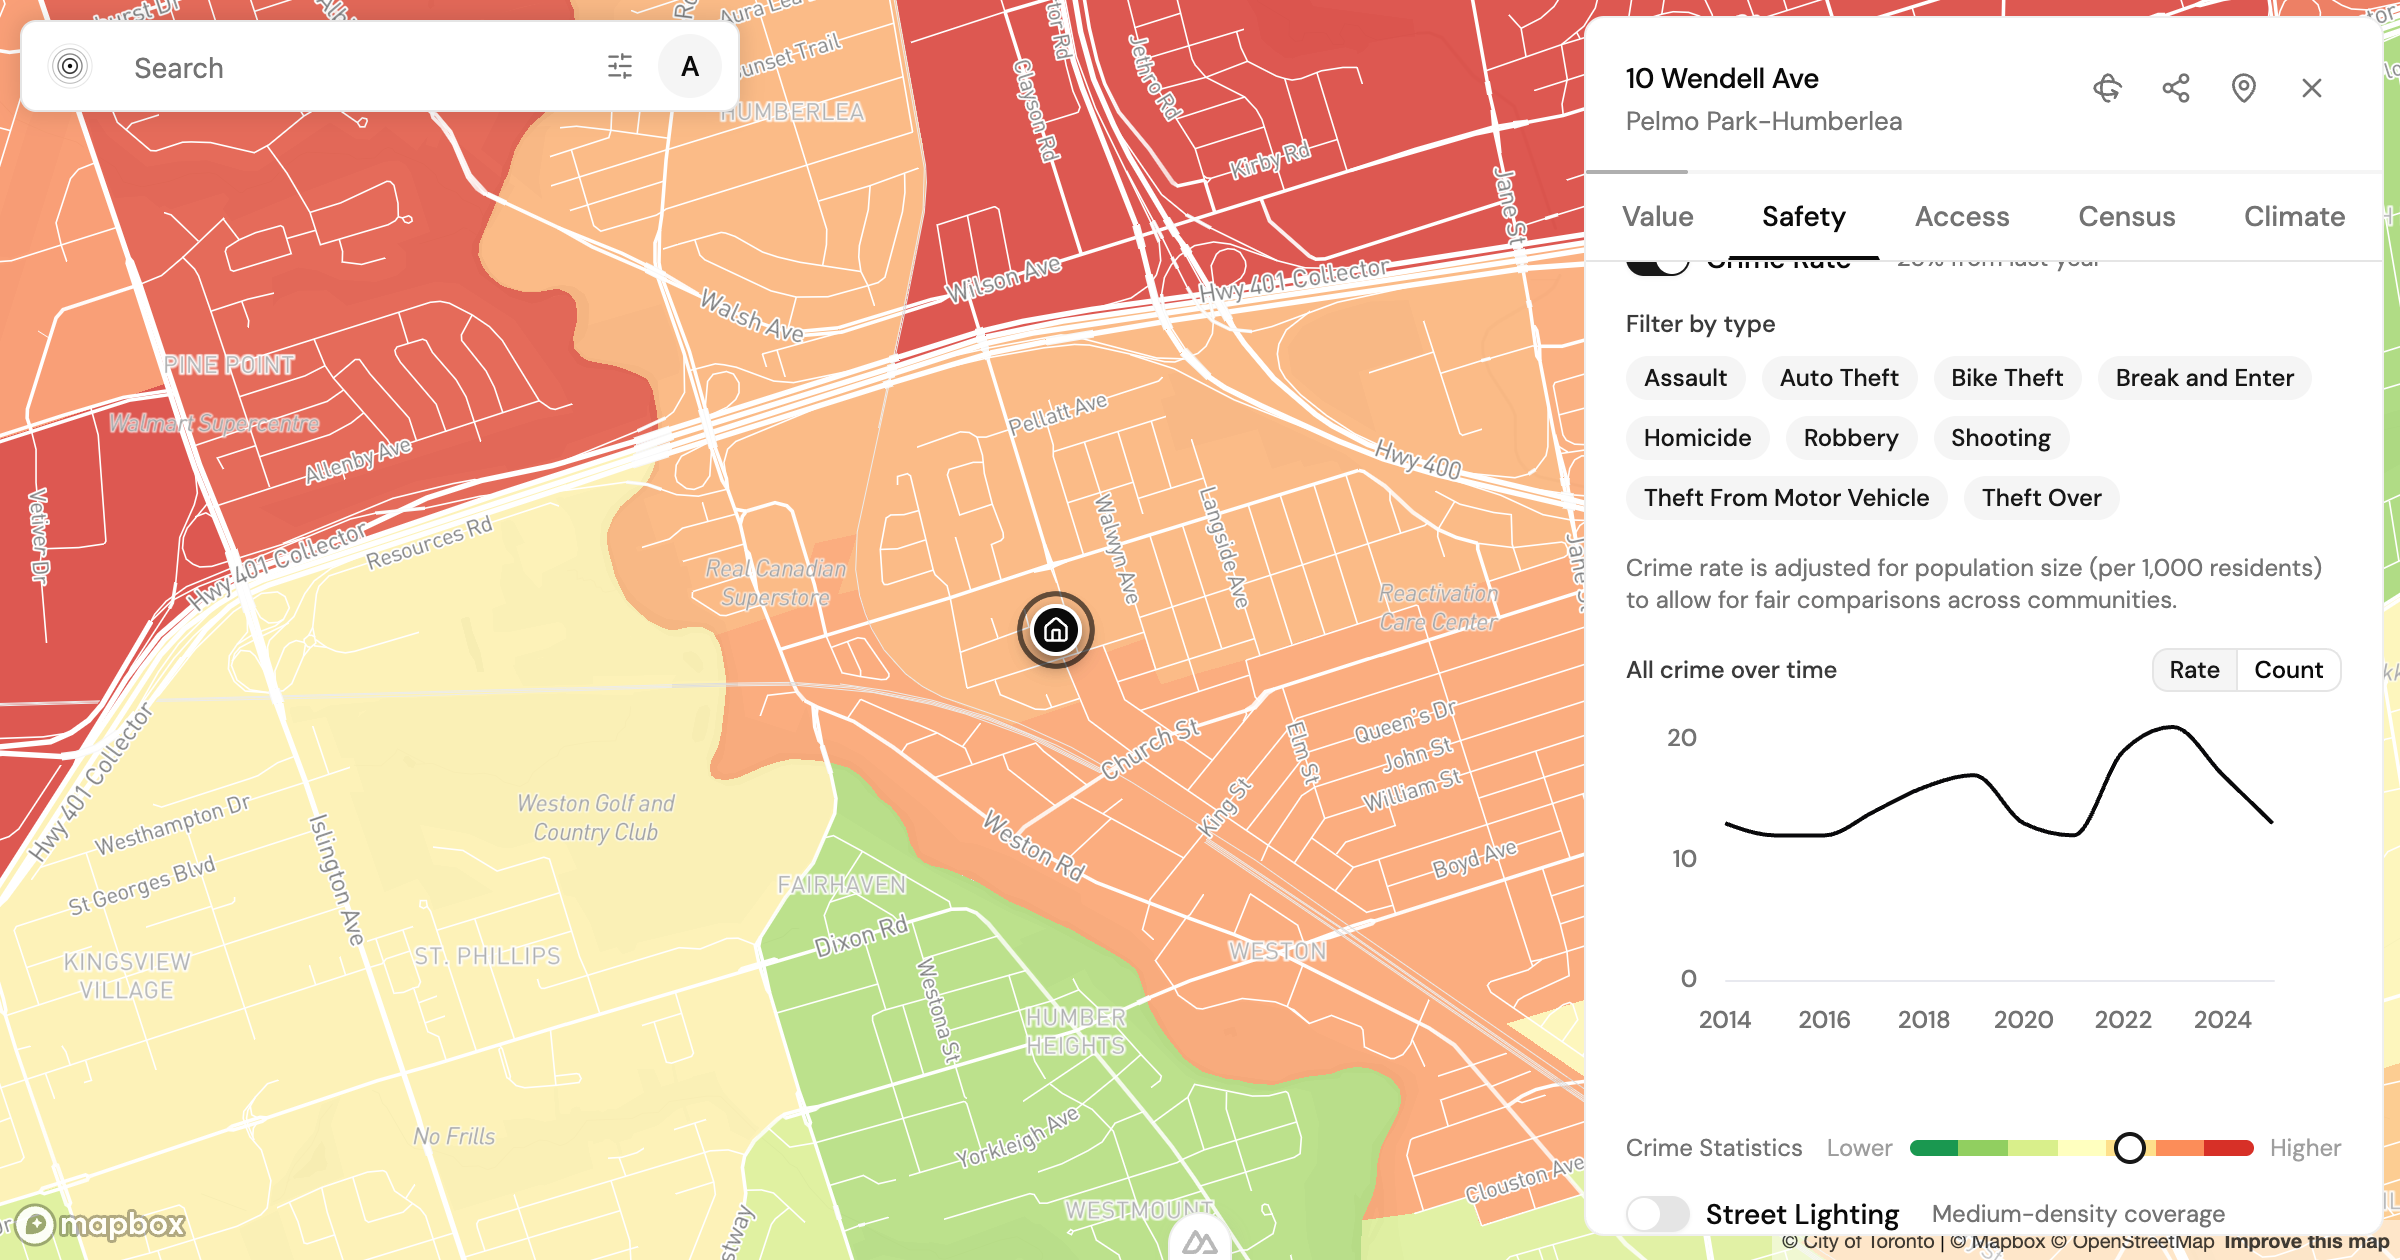
Is Pelmo Park-Humberlea Safe? How to Read Northwest Toronto's Crime Data Before You Buy
Is Pelmo Park-Humberlea safe? We read Toronto's 2025 crime data by category and trend to show how to weigh a northwest Toronto safety score before you buy.
Find my place
Say what matters to you and the whole city gets ranked against it, with what each place asks you to give up.
Find my place