Agincourt, Toronto: What the Neighbourhood Data Shows
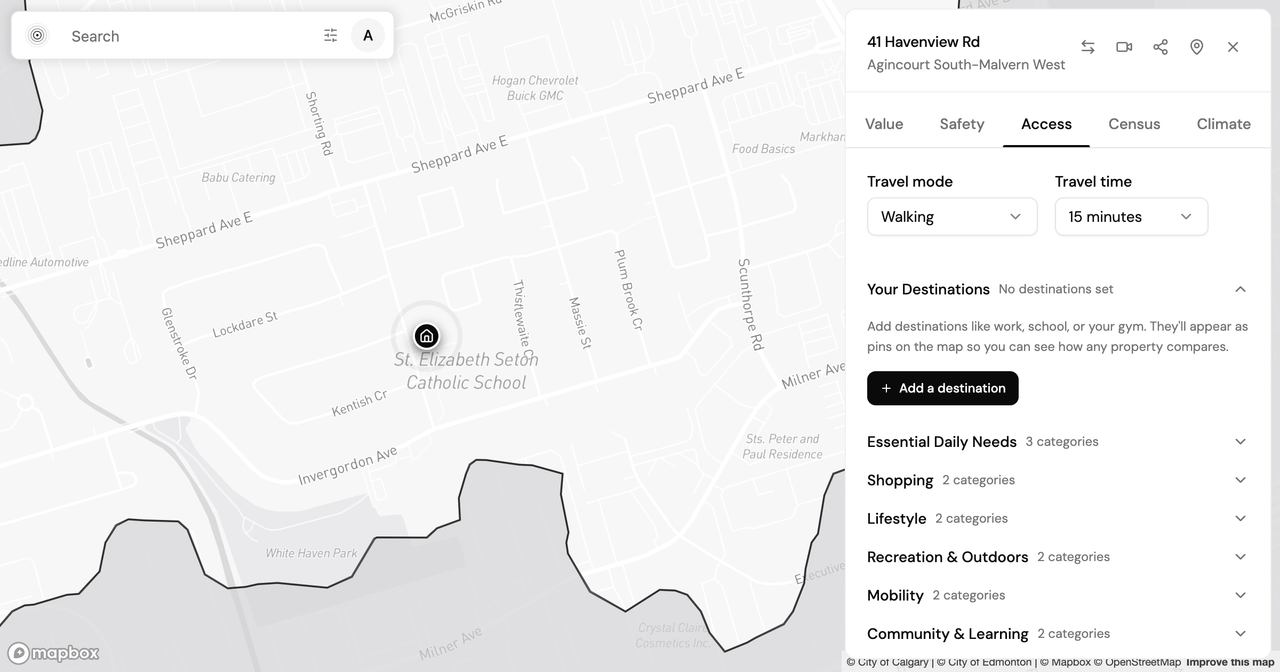
Data freshness: Crime figures are Toronto Police Service community statistics through year-end 2025. Population, household, and demographic figures come from the Statistics Canada 2021 Census. The property-value figure is modelled from 2021 Census dissemination-area median dwelling values, indexed to a 2024 vintage. See the note at the end for what these numbers cover and what they leave out.
You've found a house in Agincourt South-Malvern West that fits an east Toronto budget, and the listing tells you the price, the square footage, and not much else about the community around it. That gap is where most of the decision lives. The Agincourt Toronto neighbourhood data (census, accessibility, and safety, read together) describes a mature, ownership-heavy pocket of inner Scarborough whose character the sticker price never mentions.
Here is what those numbers show, and how to read them before you make an offer.
What the 2021 census says about who lives here
Agincourt South-Malvern West reads as a settled, family-scale community. The median age is 43, the average household holds 2.8 people, and 69.4% of homes are owner-occupied against 30.6% renters. That ownership share points to a neighbourhood where people buy in and stay rather than cycle through.
That profile matters because it shapes the things a listing photo can't. An older, ownership-heavy community tends to turn over slowly, which affects how often comparable homes come up and who your neighbours are likely to be. If you are weighing a long-term purchase over a shorter stay, the census is the first lens that tells you which one you are looking at.
What a 15-minute walk actually reaches
Agincourt was built around the car, and the accessibility data says so plainly. On the Accessibility lens, the community scores 38 out of 100, with transit access in the 40th percentile, below the Toronto median. Within a strict 15-minute walk, four grocery stores are reachable.
Four groceries on foot is not nothing, but the scores set the expectation: for most daily errands here, the honest assumption is a short drive rather than a walk. If a walkable, transit-first routine is what you weight most, the data points you toward denser communities closer to the core. If you drive anyway and value space over a 15-minute-neighbourhood lifestyle, these numbers read very differently. The lens doesn't settle that trade-off; it makes it measurable. You can see how the same test plays out across every Toronto neighbourhood, ranked on the same lenses, or open the Agincourt South-Malvern West dashboard directly.
The crime picture, and which direction it's moving
Agincourt South-Malvern West recorded 331 reported incidents in 2025, or 11.6 per 1,000 residents, which places it around the 55th percentile citywide by crime volume, close to the middle of the pack, not an outlier in either direction. The rate per 1,000 matters more than the raw count, because it accounts for how many people live here and lets you compare the community to anywhere else in the city on the same footing.
The trend is the part a single number hides. All-crime incidents fell 14.4% year over year. The category mix moves in different directions:
- Assault: 133 incidents, 4.7 per 1,000, down 26.2%. The largest single category, and falling sharply.
- Auto theft: 78 incidents, 2.7 per 1,000, down 21.0%. A Greater Toronto Area story for years, dropping here.
- Break and enter: 74 incidents, 2.6 per 1,000, up 20.5%. The one category rising meaningfully, and the risk the data points to most directly for a homeowner.
Those three don't sum to 331; the rest is spread across smaller categories. "Is it safe" resolves into several separate questions, and the data answers them separately. For a fuller walk-through of how to read a Toronto safety score without letting the headline number decide, the Scarborough Village safety breakdown covers the same method in a neighbouring community.
What the property-value figure is, and isn't
PickYourPlace models a median property value of $1,121,000 for Agincourt South-Malvern West. It is worth being precise about what that number is. It is derived from Statistics Canada's 2021 Census dissemination-area median dwelling values, indexed to a 2024 vintage, not an MPAC assessed value, and not tied to any assessment roll year.
That makes it useful for one thing and not another. As a consistent, city-wide yardstick for comparing communities on the same basis, it holds up. As the assessed value on a specific home, or a substitute for an appraisal, it does not: a single address can sit well above or below its dissemination-area median. Treat it as the community baseline, then let a specific property tell you where it falls against that baseline.
From a number to a decision
A percentile and a median are fast ways to know where a community stands and where to look next. They are not the analysis. When you have a specific Agincourt address in mind, an Analyze report pulls the census, accessibility, safety, and property-value readings together for that address, so they sit side by side rather than in four separate tabs. If you are choosing between here and an adjacent community like Malvern or Agincourt North, Compare puts them next to each other on the same lenses.
What the data won't do is make the call. Reported crime misses unreported incidents and flattens block-level variation into a community total. Census figures are a 2021 snapshot, so household and ownership shares have had time to shift. The numbers describe Agincourt South-Malvern West; they don't decide it for you. What they replace is a listing price and a guess with a clearer read on the community behind the address.
Keep reading

Is Highland Park Calgary Safe? Reading the Inner-North Crime Data
Is Highland Park Calgary safe? We pulled the Calgary Police crime data for this inner-north community and read a safety score of 49 category by category.

Is Oakwood Village Toronto Safe? What the Crime Data Shows
Is Oakwood Village Toronto safe? We read the Toronto Police crime data by category and trend to show how to turn a safety score into a question you can act on.
Allendale vs Windermere: Two Edmonton Neighbourhoods, Side by Side
Allendale vs Windermere in Edmonton: two communities at nearly the same assessed value that split on transit, safety, and who lives there. What the data shows.
Find my place
Tell us where you need to get to and we will route it on the real network, then rank the city on how well it serves that.
Find my place