Cost of Living in Calgary vs Toronto for Families: A Neighbourhood-Level Comparison
The "cost of living in Calgary vs Toronto" question usually gets answered at the wrong altitude. You search it, and you get a city-wide average: a median home price for all of Calgary against a median for all of Toronto, a rent index, a grocery-basket comparison. Those numbers settle the direction of the move. They do almost nothing for the decision you are actually making, which is not "Calgary or Toronto" but "this shortlist of Calgary communities, at this budget, against the specific block we are leaving."
A family relocating does not live in a city average. They live on a street, walk to one grocery store, and send children to the schools inside a catchment. The gap between the headline and the shortlist is where the real cost comparison lives, and it is where a city-level number can quietly mislead you. Here is what the neighbourhood data shows for a family weighing the two cities, and where its limits are.
Why the city average hides the number you need
A city-wide median folds together the downtown condo tower and the far-suburban detached home into a single figure. For a family, that blend is close to meaningless. The relevant comparison is between two communities that play the same role in each city: the walkable inner-city option, the established mid-density corridor, the drive-first suburb with space and a yard.
When you line up like-for-like communities instead of like-for-like cities, two things happen. The absolute dollar gap between Calgary and Toronto usually narrows from the headline number, because you are no longer comparing a Calgary suburb to a Toronto core. And the trade-offs that a family actually feels day to day, such as walkability, tenure mix, and commute shape, come into focus in a way a median price never captures.
A Calgary anchor: Sunnyside on the 2026 roll
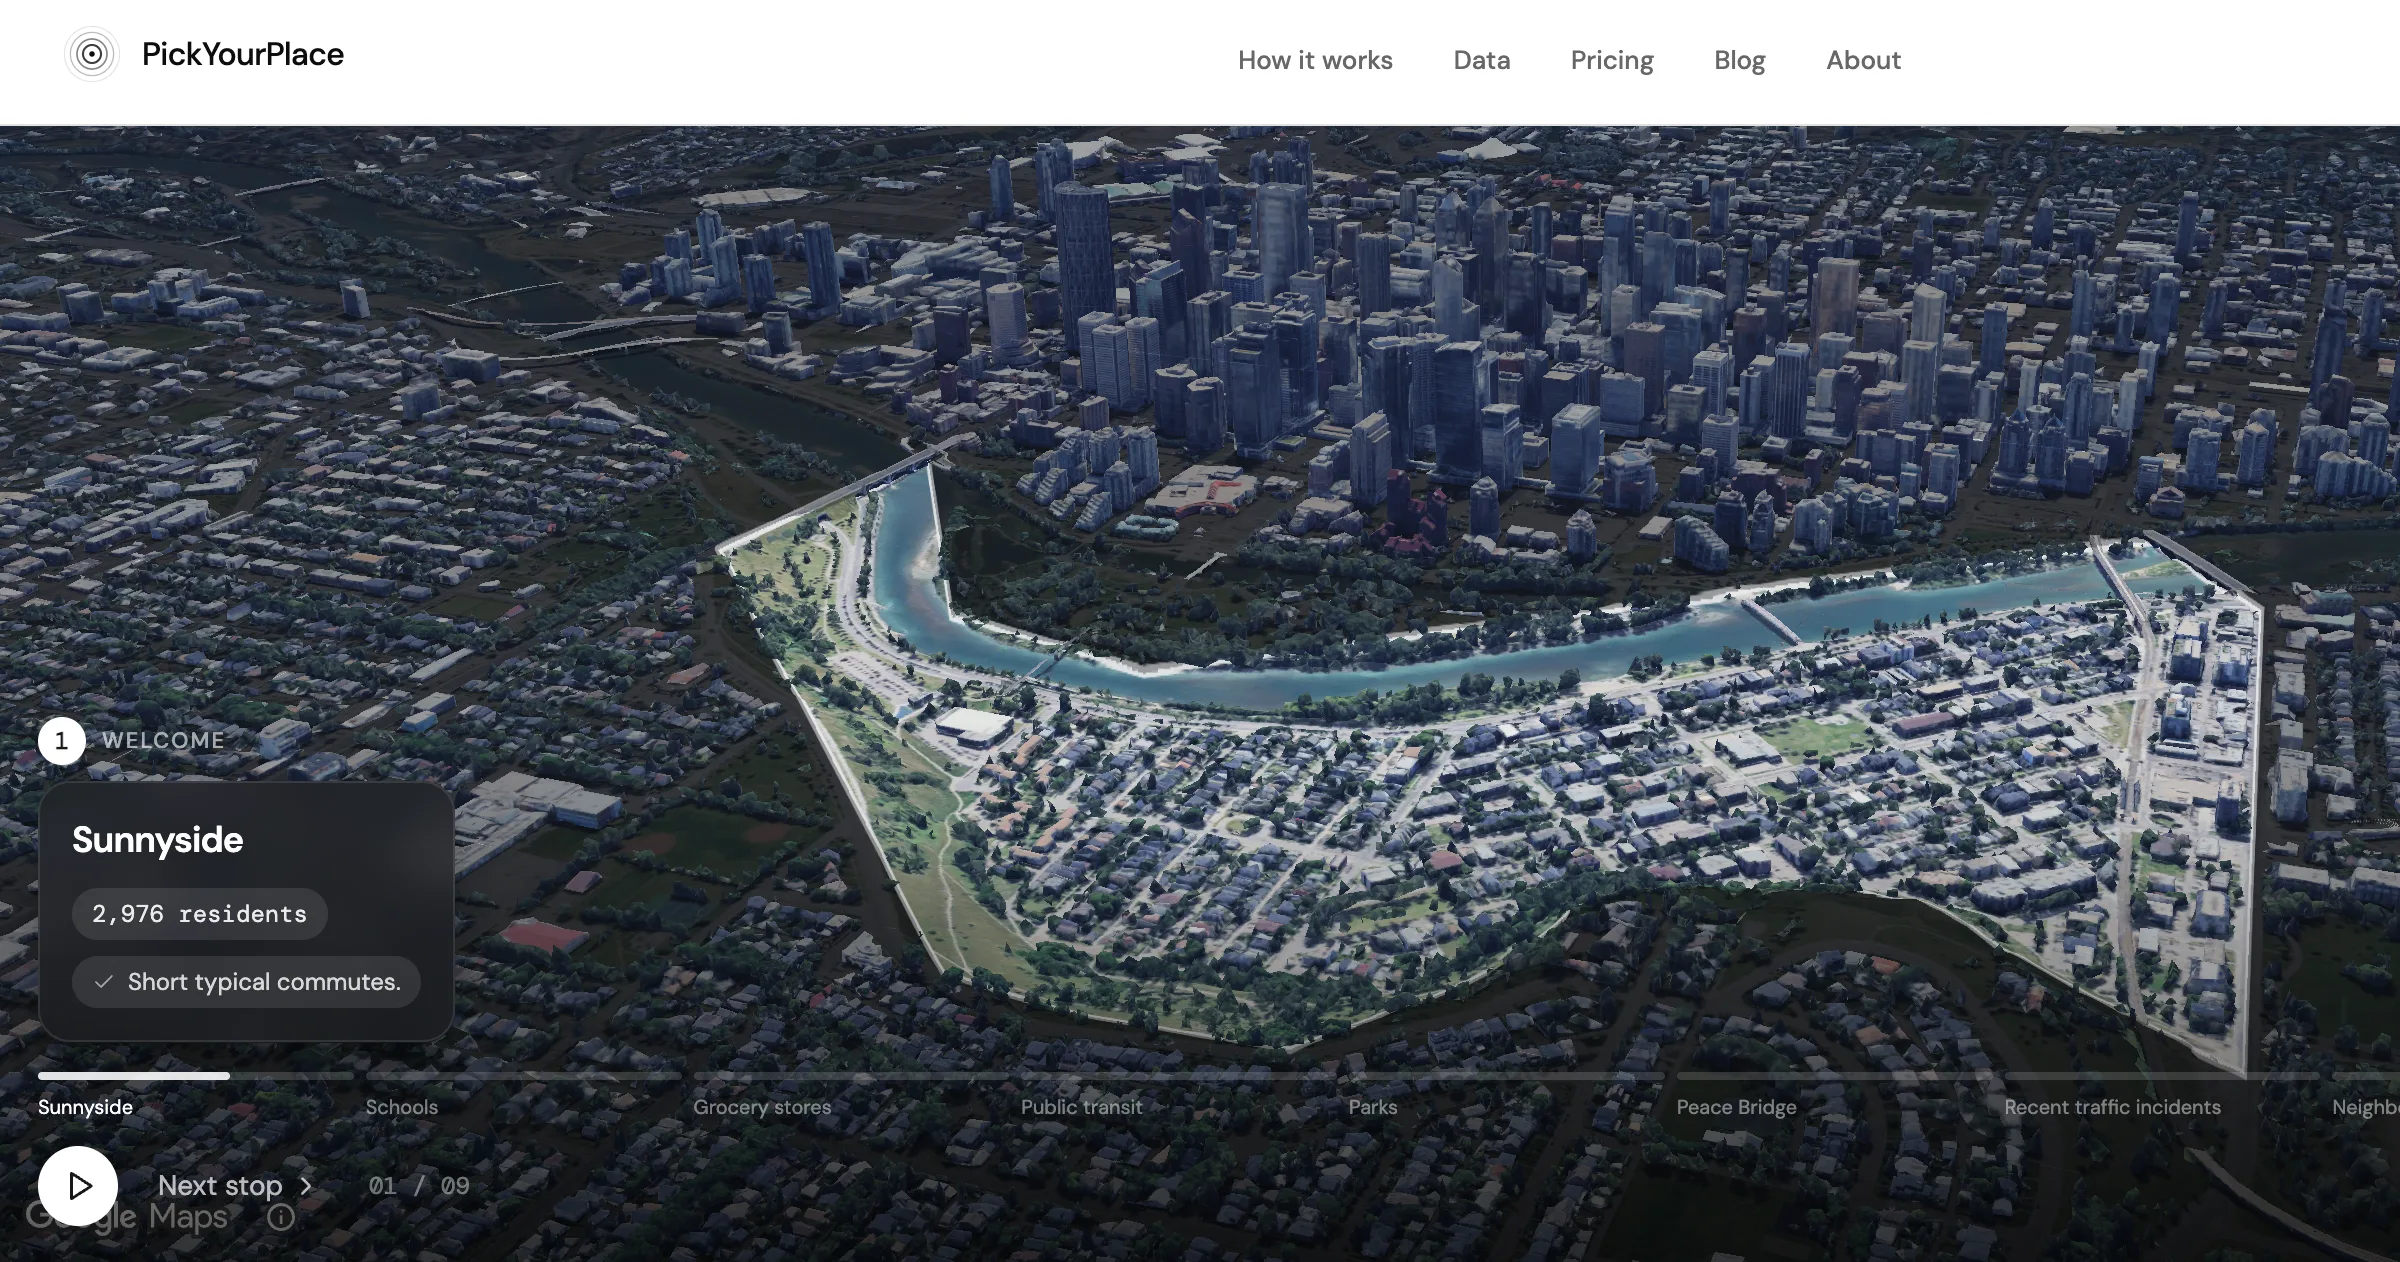
Take Sunnyside, one of Calgary's most walkable inner-city communities, sitting on the north bank of the Bow River with its own CTrain station a few minutes from downtown. It is a useful anchor because it represents the option a family often shortlists when they want to keep an urban, transit-first life after leaving a big city.
On the City of Calgary's 2026 assessment roll, Sunnyside's median assessed value is $375,500, up 22.4% over five years, with year-over-year change flat at 0.0%. The flat year and the strong five-year figure together tell a more honest story than either alone: prices climbed substantially over the period but have levelled off most recently, which matters if you are trying to time an entry rather than ride a trend.
That figure is the right anchor for a Calgary shortlist, and the wrong one for a cross-province comparison. Municipal assessment rolls are built province by province, on different cycles and methods, so a Calgary assessed value and an Ontario one are not the same measurement wearing different labels. For the Calgary-to-Toronto half of this question we use the 2021 Census instead, which measures both cities the same way on the same date. It is older than the assessment roll, and it is the only figure here that is genuinely comparable across the provincial boundary.
Matching communities, not cities
Sunnyside's data profile is walkable, transit-connected, renter-majority, and inner-city. The closest match in our Toronto data is The Annex, the university-adjacent, transit-rich neighbourhood we paired with Kensington and Sunnyside in the Toronto-to-Calgary neighbourhood matrix. Roncesvalles and Leslieville are the other names families raise, though both skew more toward ownership and family-stage households than Sunnyside does.
Once you fix the comparator, the cost comparison becomes concrete. Every figure below is Statistics Canada 2021 Census data, aggregated from dissemination areas to the community:
| 2021 Census | Sunnyside, Calgary | The Annex, Toronto |
|---|---|---|
| Median dwelling value | $525,068 | $1,461,824 |
| Median monthly rent | $1,227 | $1,768 |
| Median monthly ownership cost | $1,681 | $1,770 |
| Median income | $49,617 | $54,153 |
| Median age | 36 | 42 |
| Average household size | 1.8 | 1.8 |
| Tenure (owner / renter) | 33.2% / 66.6% | 40.7% / 59.4% |
The dwelling-value line is the one families expect: The Annex runs about 2.8 times Sunnyside. The two lines underneath it are the ones worth sitting with.
Median income barely moves. The Annex is roughly 9% higher, against a dwelling value 178% higher. Set one against the other and Sunnyside's median dwelling value is about 10.6 times its median income, where The Annex's is about 27 times. That ratio is not a lending calculation and it is not what a bank will use to qualify you, since census median income is measured per person rather than per household. As a relative index between two communities measured identically, though, it is the sharpest single number in this comparison, and it is the thing the city-average version of this question never surfaces.
Monthly shelter cost is the surprise in the other direction. Median monthly ownership cost is close to flat between the two, $1,681 in Sunnyside against $1,770 in The Annex, despite the enormous gap in dwelling value. That is a real finding with a boring explanation: the census measures what existing owners actually pay each month, and a household that bought into The Annex decades ago carries a small mortgage against a very large asset. It is not what a family buying in today would pay. Rent is the more honest read on current cost for a newcomer, and there the gap is real but modest: $1,227 against $1,768, about 44%.
Read those three lines together and the shape of the move is clear. The affordability advantage in Calgary is overwhelmingly about the price of entry, not about the monthly cost of staying. If you are buying, the gap is enormous. If you are renting, it is meaningful but smaller than the headline suggests.
The census context: who is buying, and what a family joins
Dwelling value tells you the price. The rest of the census tells you the community you would be moving into, which for a relocating family is half the decision. Sunnyside runs owner 33.2% to renter 66.6%, with a median age of 36 and an average household size of 1.8. That profile reads as a younger, renter-heavy, small-household community: active and urban, but not, on the numbers, a family-dominant one.
The Annex is not a family-dominant community either. It runs 40.7% owner to 59.4% renter with the same 1.8 average household size and a median age six years older. If you are moving between these two, the community composition is close to a wash. What changes is the price of admission, not the kind of street you live on.
This is the kind of finding worth sitting with before you commit. If your priority is an established, owner-majority community with larger households and school-age children on the street, neither of these communities is it, and a more suburban Calgary community may fit the brief better. If you want to stay in an urban, walk-everywhere rhythm and the community composition is secondary, the pairing holds. The data does not decide this for you; it tells you which question you are actually answering.
The accessibility trade-off is where the move gets real
Cost of living is not only dollars. For a family leaving a transit-first Toronto neighbourhood, the daily accessibility of the destination is a real, if unpriced, part of the ledger. This is where Sunnyside holds up unusually well for a Calgary community: it sits in the 97th percentile citywide for transit access and the 91st for everyday walkable access. The Annex ranks similarly near the top of Toronto, at the 93rd percentile for transit and the 88th for walkable access. Each is close to the best its own city offers.
Those percentiles are scored within each city, so they say nothing about how the two compare to each other. The raw counts do, and they are the honest caveat. About 14 grocery and food options sit inside a 15-minute walk of Sunnyside. In The Annex the same walk reaches about 43. Both communities rank near the top of their city; only one of them is dense enough that the ranking and the raw number agree.
The same gap holds at the city scale. Toronto's subway and streetcar network reaches far more of the city than Calgary's two-line CTrain, which works well along the line and thins out quickly off it. Sunnyside is one of the Calgary communities where a car-light life is genuinely workable; many are not. If transit reach is non-negotiable, the community you choose in Calgary matters more than it did in Toronto, because the strong options are more concentrated.
Run your own comparison
The pairing above is a starting point, not a verdict. Your Toronto community and your priorities might point to a different Calgary shortlist entirely, and the tools are built to test that rather than take it on faith.
- Put a Calgary community and a Toronto one side by side in Compare, which builds a single decision-support document across the lenses for two or three communities at once, so the value, tenure, and accessibility differences sit in one view.
- Browse and sort every scored community in Calgary or Toronto to find the like-for-like match to the neighbourhood you are leaving.
- If you want the deeper read on Sunnyside's walkable half of the city, the Kensington neighbourhood guide works through the accessibility data in detail.
A 7-day trial is free with just an email, no credit card, and the full pricing picture is there if you decide to keep going. The data will tell you which Calgary communities actually match the life your family has in Toronto, and roughly what that life costs on each side. It will not tell you how -15 °C in January feels in year one. For that, spend a weekend on your shortlist before you sign anything.
Sources and method
- Cross-city figures (the table): Statistics Canada, 2021 Census of Population, at the dissemination-area level, aggregated to community boundaries. One source, one reference date, both provinces, which is why the comparison is made here rather than on assessment data. Median income is measured per person, not per household.
- Calgary assessed values: City of Calgary 2026 property assessment roll. Assessed values are a tax-assessment measure, not listing prices, and typically run below market.
- Why there is no Toronto assessed value or five-year growth in this post: our Toronto property-value layer is modelled from census dwelling values indexed forward, not drawn from a matching annual assessment roll, so it carries no comparable five-year growth series. Quoting a Toronto "assessed value" beside a Calgary one would imply a like-for-like measurement that does not exist.
- Accessibility: PickYourPlace accessibility lens, 15-minute walking isochrones over OpenStreetMap pedestrian data. Lens scores are percentile ranks within each city and are not comparable across cities; raw destination counts are.
- All neighbourhood figures were pulled live from the PickYourPlace production database on 30 July 2026.
Related reading
Keep reading

Who Lives in Dunbar-Southlands, Vancouver? A Census and Property-Value Read
Who lives in Dunbar-Southlands, Vancouver? We read the census profile against the 2026 assessment roll to show buyers what the numbers say.

Moving From Toronto to Calgary: Where to Live
Moving from Toronto to Calgary and unsure where to live? See how Ask turns plain-language questions into live neighbourhood data, then try it free.
Is the Highlands Edmonton Safe? What the Crime Data Actually Shows
Is the Highlands Edmonton safe? We pulled the Edmonton Police Service crime data for this established north-side community and read it category by category.
Start my move
Tell us about the move and we will narrow the city down to places that fit, with the reasons and the trade-offs. No account needed.
Start my move