Is the Highlands Edmonton Safe? What the Crime Data Actually Shows
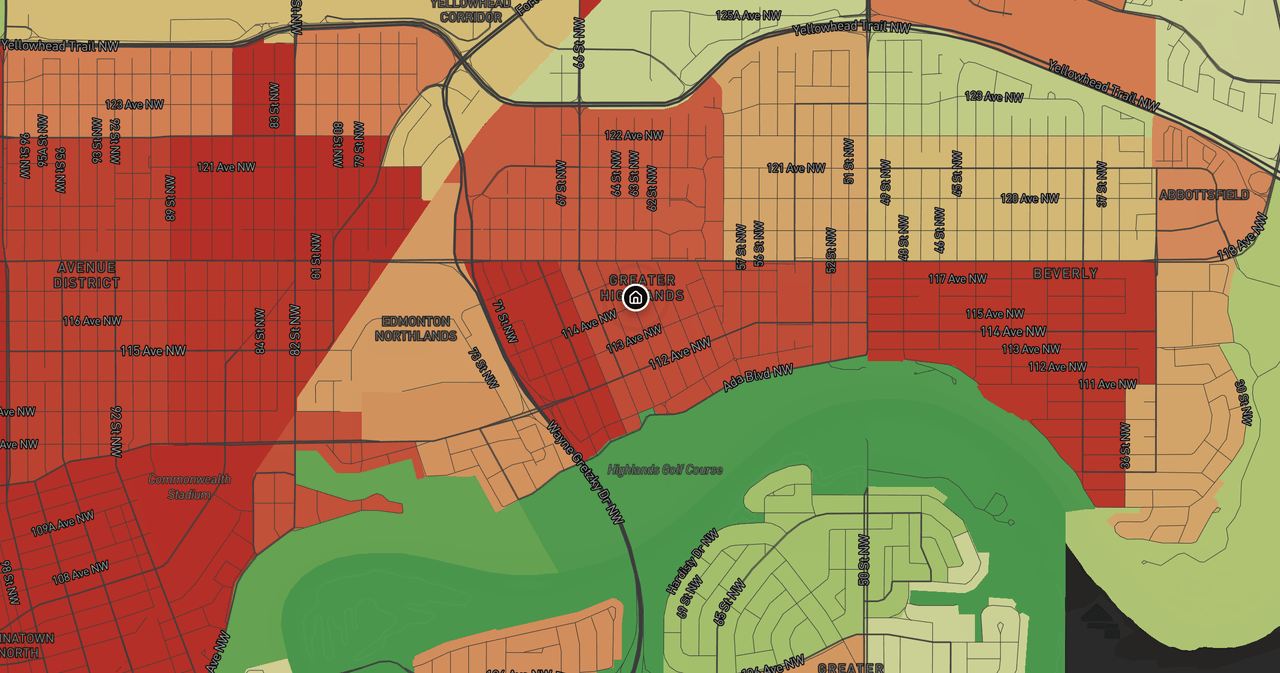
Data freshness: Edmonton Police Service and City of Edmonton open data, pulled live from the PickYourPlace database on 29 July 2026, with 2025 as the most recent complete year. Population and demographics from the Statistics Canada census. Property values from the City of Edmonton 2026 assessment roll. See the closing section for what these numbers do and do not cover.
You have found a house in the Highlands. It is a character home on a quiet street near the river valley, the price fits, and the drive downtown is short. Then someone points you at a Reddit thread, and the question lands the way it always does: is the Highlands safe?
If you are buying in northeast Edmonton, you have probably run into some version of this. The Highlands is one of the city's older communities, established and owner-heavy, the kind of place where a single anecdote can colour a whole search. But an anecdote is not a pattern. Here is what the Edmonton Police Service and City of Edmonton data show for the Highlands, and where the quick read gets it wrong.
The Highlands at a Glance
The honest headline is that the raw crime rate and the safety score point in slightly different directions, and the gap between them is the whole story. Four numbers frame it:
| Measure (2025) | Highlands |
|---|---|
| Safety score | 54 out of 100 (Edmonton median 58) |
| Reported incidents | 285 (59.1 per 1,000 residents) |
| All-crime trend | Up 5.9% year over year |
| Median assessed value (2026 roll) | $432,500 |
A rate of 59.1 incidents per 1,000 residents reads as high on its own, and on reported volume alone the Highlands does sit in the busier end of the city. Yet its composite safety score is 54 out of 100, a little under the Edmonton median of 58 rather than far down the table. That is not a contradiction. It is a signal that the score is measuring more than one thing.
Why the Score Sits Higher Than the Raw Rate
PickYourPlace's safety lens does not stop at counting incidents. The 0-to-100 score blends reported crime with the other factors that shape day-to-day safety: traffic history, street lighting, ambient noise, and how close police, fire, and health services are. A community can carry an above-average incident rate and still land near the middle overall because those other components work in its favour.
The Highlands is that case. Each component is worth reading against the Edmonton median rather than on its own:
| Safety component | Highlands | Edmonton median |
|---|---|---|
| Crime | 18 | 57 |
| Street lighting | 69 | 30 |
| Fire access | 79 | 44 |
| Healthcare access | 62 | 44 |
| Noise | 57 | 44 |
| Police access | 31 | 41 |
| Traffic | 100 | 100 |
Crime is the clear drag, and it is the 59.1 figure showing up in the score. Street lighting is the standout in the other direction, more than double the city median, with fire access, healthcare access, and noise all comfortably above the middle. Two rows earn an asterisk: police access lands below the median, and traffic sits at 100 for the Highlands and for 333 of Edmonton's 337 communities, so it lifts every score equally and says nothing about this neighbourhood in particular.
That is how a busy incident count resolves into a 54: one badly lagging component, offset by lighting and emergency-service access that genuinely beat the city, with police proximity working against it rather than for it.
This is worth sitting with before you judge the neighbourhood on the 59.1 figure alone. A single number compresses several measures into one, and the compression hides the trade-off. If you want the full breakdown of what goes into a community score and why the components can disagree, we walk through it in how neighbourhood scoring works.
The Category Breakdown: Property Crime Is the Line to Watch
A neighbourhood's incident total matters less than what those incidents are. Split the Highlands' 2025 count into categories and a clear pattern appears.
- Property crime dominates, and it is rising. At 154 incidents (31.9 per 1,000), property crime is more than half the total, and it climbed 18.5% year over year. This is the single line the data points at most directly, and much of it, theft from vehicles and similar, is insurable and partly within your control through where and how you park and store things.
- Mischief and graffiti is falling. At 34 incidents (7.1 per 1,000), this category dropped 15.1% year over year.
- Personal violence is low and declining. At 28 incidents (5.8 per 1,000), violent crime is the smallest of the three and fell 6.6% year over year.
Read together, the mix leans toward property offences against a backdrop of low and shrinking violence. That is a materially different lived experience than a neighbourhood carrying a comparable total driven by assaults.
The Trend Is the Signal
A one-year snapshot tells you where a place sits. The trend tells you which way it is moving, and that is often the more useful read for a buyer planning to stay several years.
The Highlands' all-crime count rose 5.9% year over year. Almost all of that increase traces to property crime, up 18.5%, while both mischief and personal violence moved the other way. So the upward tick is not broad. It is concentrated in one category, and it is the category most responsive to prevention. What the trend supports is narrower and more practical than a blanket "getting worse" story: watch property crime, and note that the violence trend is moving in a buyer's favour.
Who Lives Here, and What That Adds
Safety data reads differently once you know who is around it. The Highlands is owner-heavy, at 79.3% owner-occupied, with a median age of 44 and an average household size of 2.2. High ownership tends to mean lower turnover and longer tenure, which is context for how a community reports and responds to property crime rather than a safety verdict in itself.
The value picture is steady rather than dramatic. The median assessed value on the 2026 roll is $432,500, up 12.3% over five years and 2.0% in the latest year. For daily errands, the data counts 2 grocery destinations reachable in a 15-minute walk, a reminder that an established residential community and a dense walkable core are different products. If walk-to-groceries is a priority, that is a number to weigh, not a flaw to hold against the neighbourhood.
See It for a Specific Highlands Address
Community data is one layer. A specific address is another, because two homes under the same neighbourhood label can sit in genuinely different settings. That is what an address-level report is for.
The full safety breakdown for the Highlands lets you see the score's components side by side rather than as one blended figure, and the Highlands neighbourhood page puts safety next to value, access, and demographics. To ground it in the home you are actually considering, run an Analyze report for the exact address and the scores, the walk radius, and the balance of lenses all shift to match it. Share the report with your agent before the showing; it reads as well across a kitchen table as it does on a screen.
What the Data Doesn't Capture
The data shows that the Highlands reports an above-average incident rate but still scores 54 out of 100 once traffic, street conditions, and service access are weighed, that property crime dominates and is rising while violence is low and falling, and that this is an owner-heavy, established community with steady values.
Here is what the numbers leave out:
- Perceived safety: how safe you feel walking home late on a weeknight.
- Unreported incidents: a known gap in all crime statistics, especially for low-level theft and vandalism.
- Block-level variation: the figures describe the community; people live on individual streets.
- Time-of-day patterns: annual totals flatten the difference between an afternoon and a 2 a.m. stretch.
- What a 54 is: a weighted composite out of 100, not a rank. It is not the same as saying the Highlands is safer than 54% of Edmonton, and the components can disagree, which is why the breakdown above matters more than the headline.
Scores are doors, not verdicts. If you prioritize an established, owner-heavy community with low violence and are willing to plan around vehicle-focused property crime, the Highlands' trade-off may fit. If a rising property-crime line is a dealbreaker regardless of category, the same data tells you exactly which trend to keep watching. Either way, the read starts with the numbers, not the thread.
Keep reading

Who Lives in Dunbar-Southlands, Vancouver? A Census and Property-Value Read
Who lives in Dunbar-Southlands, Vancouver? We read the census profile against the 2026 assessment roll to show buyers what the numbers say.

Moving From Toronto to Calgary: Where to Live
Moving from Toronto to Calgary and unsure where to live? See how Ask turns plain-language questions into live neighbourhood data, then try it free.
Cost of Living in Calgary vs Toronto for Families: A Neighbourhood-Level Comparison
A neighbourhood-level look at cost of living for families weighing Calgary against Toronto, using census dwelling values, shelter costs, income, tenure, and walk-isochrone data.
Check a neighbourhood
Every neighbourhood has a page with its safety rank, what that rank measures and what it cannot tell you. Free, and no account.
Check a neighbourhood