Is Inglewood Calgary Safe? What the 2025 Crime Data Actually Shows
Data freshness: Calgary Police Service community crime statistics through year-end 2025. Population and demographics from the Statistics Canada 2021 Census. Property values from the City of Calgary 2026 assessment roll. Every Inglewood figure below is pulled live from the PickYourPlace database. See the Methodology section for sources.
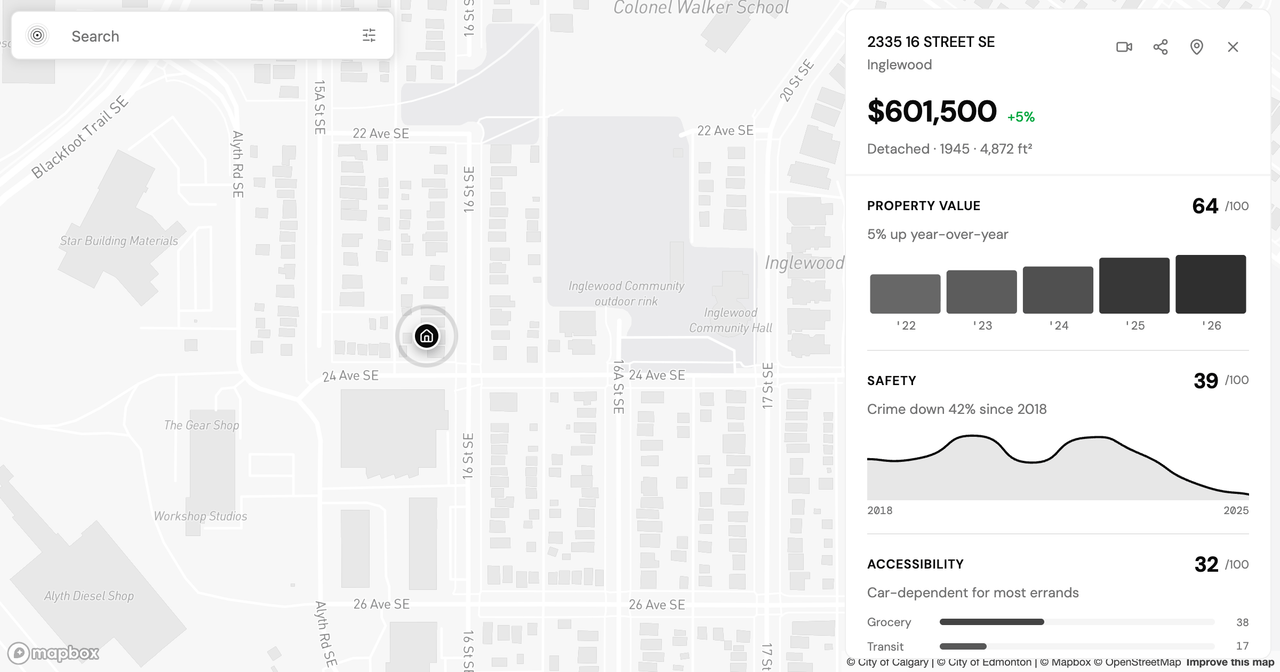
You've shortlisted a house in Inglewood. The character streets off 9th Avenue, the walk to the Bow River pathway, the record shops and breweries a few minutes from the door. Then you open the safety score, and it comes back at 39 out of 100. The reassurance drains out of the afternoon.
That number looks like a grade, and a 39 reads like a failing one. It isn't a grade. It's a door. Here is what the 2025 Calgary Police data actually shows for Inglewood, and why the headline score and the trend point in different directions.
What a 39 actually means
Inglewood's composite safety score is 39 out of 100, below the Calgary community median of about 48, which ranks it in the 21st percentile of Calgary communities. On the composite alone, Inglewood sits in the lower-middle of the city.
The important thing about that ranking is that it compares Inglewood against every other Calgary community, not against a safety threshold. A 39 does not say "unsafe." It says roughly four in five Calgary neighbourhoods score higher on this blended measure, and that you should look at what the blend is made of before you draw a conclusion. The rest of this post opens the score into its parts: the crime volume, the category mix, the trend, and the pieces of the score that have nothing to do with crime at all.
The crime volume picture
Inglewood recorded 98 reported incidents in 2025, a rate of 24.4 per 1,000 residents. That rate sits around the 74th percentile citywide for crime volume, meaning Inglewood reports more crime per resident than roughly three-quarters of Calgary communities, and it runs above the citywide rate of 15.2 per 1,000.
So far this supports the cautious read. The trend complicates it. All-crime in Inglewood fell 19.0% year over year. The neighbourhood carries an above-average volume for the city, and that volume is declining, not climbing. A single score photographed at one moment cannot show you that motion, which is exactly why the direction of travel belongs in the decision.
Category by category
A neighbourhood's crime rate is an average of very different things, and the mix matters more than the total. Three categories carry most of Inglewood's 2025 volume, and they are not all moving the same way:
- Theft from Vehicle: 24 incidents (6.0 per 1,000), down 41.5% year over year. The single largest category, and the fastest-falling. This is property crime aimed at cars, the most behaviour-mitigable risk on the list, and in Inglewood it is retreating sharply.
- Break and Enter Commercial: 22 incidents (5.5 per 1,000), up 83.6% year over year. Break-ins at businesses rather than homes, and the fastest-rising category. Inglewood's commercial strip along 9th Avenue concentrates this risk on storefronts, not dwellings, though a steep one-year jump on a small base is worth watching rather than extrapolating.
- Theft of Vehicle: 12 incidents (3.0 per 1,000), up 49.7% year over year. Fewer incidents, but rising. Whole-vehicle theft is harder to mitigate than theft from a vehicle, so the smaller count carries more weight per incident.
Read together, these tell a more specific story than the composite: the largest risk is falling fast, while two smaller categories are climbing off low counts. If you keep a car in Inglewood, the data points you at where to park and how to secure it far more clearly than a single score ever could.
Why the score sits at 39 even as crime falls
If reported crime dropped 19% in a year, why does the composite score still land at 39? Because the safety score is not a crime score. It blends reported crime with several other percentile-ranked components: urban noise, street lighting, traffic incidents, and proximity to police, fire, and health services. A neighbourhood can improve on crime volume while its noise, lighting, traffic, or emergency-access rankings hold it in place.
This is the same pattern that shows up across Calgary's inner city. In our look at whether Beltline is safe, a very high crime reading was partly offset by strong emergency-service access, so the composite landed higher than the crime component alone. Inglewood's 39 is a blend of the same kind. The score is a summary, and summaries hide the components that actually shape a decision. That is the argument for reading the parts, not the headline.
What an address-level report adds
A neighbourhood score describes a whole community. You are buying one address. Two houses on opposite ends of Inglewood share a single community score while sitting in measurably different settings, and the composite cannot tell them apart.
An Analyze report re-runs the safety data for a specific address and puts it beside the other lenses, so the safety question sits in context rather than alone:
- Value. Inglewood's median assessed value is $388,500 on the 2026 roll, up 31.9% over five years and flat (0.0%) in the latest year. That five-year growth is the number worth holding next to the safety picture.
- Census. Median age 39, average household size 1.9, and an ownership split of 55.5% owner-occupied to 44.3% renter. A near-even owner-renter mix is unusual for a neighbourhood this established, and it shapes who your neighbours are.
- Safety. The full category breakdown above, plus the multi-year trend rather than a single year, scored for your specific address.
Seeing the lenses together is the point. A 39 on safety reads differently when the same address shows 31.9% five-year value growth and a stable ownership base.
How to use the score before you make an offer
Treat the 39 as a prompt to look closer, not a reason to walk. The data supports a narrow, useful reading: Inglewood carries an above-average crime volume for Calgary, that volume fell 19% in the past year, the largest single risk (theft from vehicle) is dropping fast, and two smaller categories are rising off low counts and worth monitoring.
What the numbers do not capture is worth stating plainly. They miss how safe you feel walking home at 11 PM, unreported incidents (a known gap in all crime statistics), time-of-day patterns that annual totals flatten, and block-level variation within a single community. Numbers describe. They don't decide.
If you prioritize walkability, character, and proximity to the river and the inner-city core, Inglewood's trade-off may fit, with vehicle-related theft as the risk to plan around. If a low reported-crime count is your single hardest constraint, the same data points you toward quieter, lower-volume communities. Either way, the decision is yours to make on the evidence, not the score's to make for you.
Start with the community-level view on the Inglewood safety page, then generate a full Analyze report for the specific address you're weighing to see all five lenses together. PickYourPlace offers a 7-day free trial, no credit card required; see pricing for what each tier covers.
Methodology and sources
- Crime data: Calgary Police Service community-level incident statistics, pulled live from the PickYourPlace database, with 2025 as the most recent complete year and year-over-year change measured against 2024.
- Safety score: a PickYourPlace 0-to-100 composite blending percentile-ranked reported crime, traffic, street lighting, urban noise, and proximity to police, fire, and health services.
- Population and demographics: Statistics Canada, 2021 Census, aggregated to community polygons.
- Property values: City of Calgary 2026 assessment roll, aggregated by community.
- Citywide rate is population-weighted across all Calgary communities for the stated year.
Keep reading

Is Highland Park Calgary Safe? Reading the Inner-North Crime Data
Is Highland Park Calgary safe? We pulled the Calgary Police crime data for this inner-north community and read a safety score of 49 category by category.

Is Oakwood Village Toronto Safe? What the Crime Data Shows
Is Oakwood Village Toronto safe? We read the Toronto Police crime data by category and trend to show how to turn a safety score into a question you can act on.
Allendale vs Windermere: Two Edmonton Neighbourhoods, Side by Side
Allendale vs Windermere in Edmonton: two communities at nearly the same assessed value that split on transit, safety, and who lives there. What the data shows.
Check a neighbourhood
Every neighbourhood has a page with its safety rank, what that rank measures and what it cannot tell you. Free, and no account.
Check a neighbourhood