Is Kitsilano Safe? What Vancouver's Crime Data Actually Shows
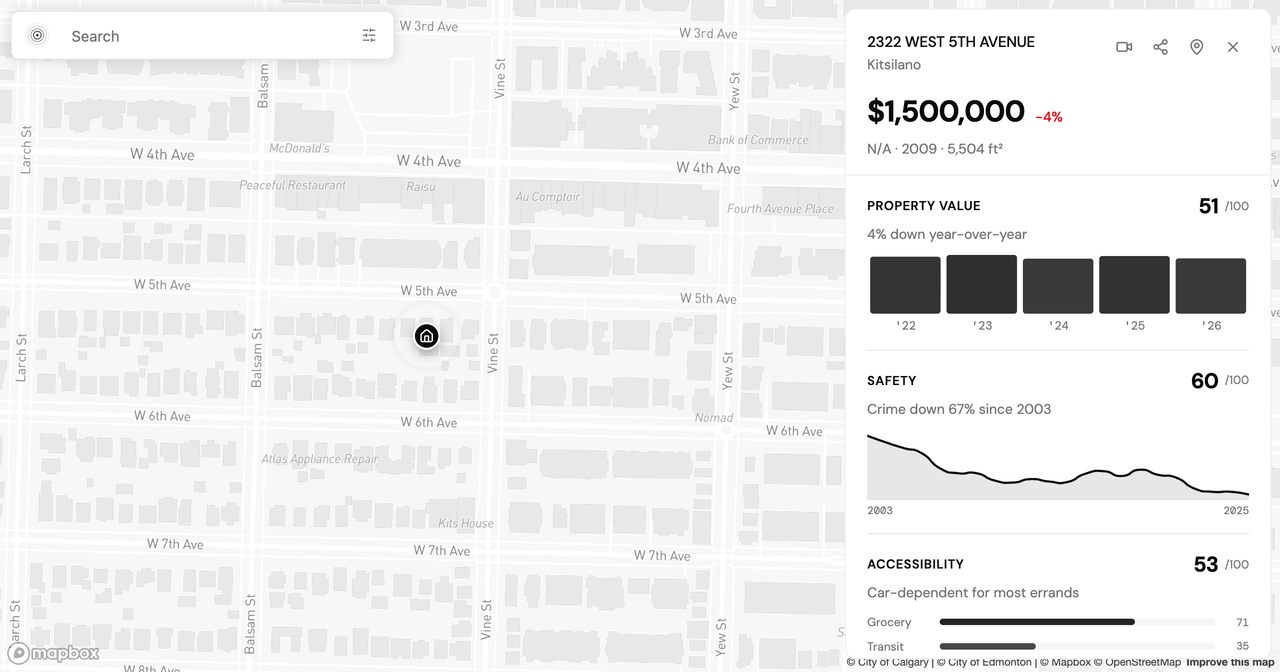
Data freshness: Vancouver Police Department incident data through year-end 2025, mapped through the PickYourPlace Safety lens. Population and demographics from the Statistics Canada 2021 Census. Property values from the BC Assessment 2026 roll. Every neighbourhood figure below is pulled from the PickYourPlace database (2026-06-29). See the closing note on what the data does not capture.
You've shortlisted a place in Kitsilano. The beach is a ten-minute walk, the commute works, and then a friend asks the question that stalls the whole decision: is Kitsilano safe? It's a fair question, and it's usually asked in the wrong place: a forum thread, a comment section, a half-remembered story about a break-in. Those answers are impressions. Vancouver Police Department records actual incidents, and PickYourPlace maps them, so the question has a data answer as well as a folklore one.
In this post you'll see how Kitsilano scores on safety, which incident types drive the count and which way they're trending, how it lines up against Kerrisdale on the same lens, and what a score can and cannot tell you before you buy.
The Right Question, Asked in the Wrong Place
The trouble with "is Kitsilano safe?" isn't the question. It's that most answers rank a whole neighbourhood on a single anecdote. A neighbourhood with high theft-from-vehicle counts is a different lived experience than one with high assault rates, and an annual total is a different fact than a three-year trend. The useful version of the question breaks into three: how does Kitsilano rank against the rest of Vancouver, which incident types make up the count, and which way is each one moving? The data answers all three.
What the 2025 Data Shows: 1,129 Incidents in Context
On the PickYourPlace Safety lens, Kitsilano scores 60 out of 100, a weighted composite of reported crime with traffic, lighting, noise, and access to emergency services. That's the headline, and on its own it hides the more interesting number underneath it.
Kitsilano recorded 1,129 reported incidents in 2025, or 26.2 per 1,000 residents. In absolute terms that count is high, which is what a busy beach-and-commercial neighbourhood produces. But adjusted for how many people live there, Kitsilano's crime volume ranks in the 38th percentile, below the city median, despite the large raw count. That gap between the absolute number and the per-resident rank is exactly what a scored lens exists to surface, and it's the gap a forum thread never sees. Reported crime across all categories was also down 8.6% year over year.
Incident Breakdown: Which Categories, Trending Which Way
The composite score smooths over the category mix, and the mix is where the decision actually lives. Three categories account for most of Kitsilano's volume:
- Theft (Other): 484 incidents (11.2 per 1,000). The single largest category, and it fell 23.4% year over year, the steepest decline in the mix.
- Theft from Vehicle: 210 incidents (4.9 per 1,000), down 7.9%. This is the risk most within a resident's control, through where and how a car is parked.
- Property Damage (Mischief): 158 incidents (3.7 per 1,000), up 18.0%, the one category moving the other way.
Property crime, not violent crime, drives Kitsilano's count, and the two largest categories are both falling. Mischief is the outlier worth watching, though it starts from a smaller base. Scores are doors, not verdicts: a safety score of 60 tells you to look at which crimes and where, not to stop looking.
Kitsilano and Kerrisdale on the Same Lens
Reading two neighbourhoods across the same lens is more useful than any single score. Kerrisdale is another west-side neighbourhood buyers weigh against Kitsilano, so here they are side by side on 2025 data.
| Measure (2025) | Kitsilano | Kerrisdale |
|---|---|---|
| Safety score (out of 100) | 60 | 57 |
| Reported incidents | 1,129 | 353 |
| Rate per 1,000 residents | 26.2 | 23.3 |
| Crime volume percentile | 38th | 29th |
| All-crime year over year | −8.6% | −1.1% |
| Median assessed value (2026 roll) | $1,211,450 | $3,175,000 |
The two land within three points of each other on the composite, and Kerrisdale carries a lower absolute count and a lower per-resident rank. But the trend tells a different story than the level: Kerrisdale's largest category, Theft (Other), rose 38.5% year over year, while Kitsilano's same category fell 23.4%. A lower-count neighbourhood can be trending up while a higher-count one trends down, which is why the direction of travel is a separate fact from the size of the number. The value gap is the other headline: Kerrisdale's median assessment is more than 2.5 times Kitsilano's.
What the Score Opens, and What It Doesn't
A score places Kitsilano against the rest of Vancouver. It does not resolve the decision on its own, and it leaves out things that matter on a specific street:
- Block-level variation. The commercial strips along West 4th and West Broadway carry a different incident profile than a quiet residential block. One neighbourhood label covers both.
- Unreported incidents. A known gap in all crime statistics, especially for low-level theft and vandalism.
- Time-of-day patterns. An annual total flattens the difference between a 3 PM block and a 2 AM one.
- The denominator. Per-1,000 rates use residential population, but Kitsilano absorbs a large daytime and beach population that isn't in the denominator, which can make per-resident rates read higher than any one resident's actual exposure.
If a low reported count is your top priority, the same data points you toward that comparison; if walkability and beach access carry more weight, Kitsilano's trade-off may fit. That's decision support, not a verdict. For the equivalent read on a Calgary neighbourhood with a similar reputation problem, see Is Beltline Calgary safe?.
Read Your Specific Vancouver Address
Neighbourhood data is one layer; the address is another. You can open the live Safety lens for Kitsilano to toggle categories, or start from the Explore map for Vancouver and compare Kitsilano against any other neighbourhood on the Vancouver hub. To turn the neighbourhood score into a read on one property, generate an Analyze report: every report runs the full pipeline, on the free 7-day trial and on every plan, and breaks safety into each incident category and its multi-year trend for a specific address, so a fear becomes a structured question with numbers attached.
That's where the decision actually gets made, on a block rather than on a label. I'd love to hear how this reads against your own experience of Kitsilano, so please reach out if you have questions or corrections.
Keep reading

Is Highland Park Calgary Safe? Reading the Inner-North Crime Data
Is Highland Park Calgary safe? We pulled the Calgary Police crime data for this inner-north community and read a safety score of 49 category by category.

Is Oakwood Village Toronto Safe? What the Crime Data Shows
Is Oakwood Village Toronto safe? We read the Toronto Police crime data by category and trend to show how to turn a safety score into a question you can act on.
Allendale vs Windermere: Two Edmonton Neighbourhoods, Side by Side
Allendale vs Windermere in Edmonton: two communities at nearly the same assessed value that split on transit, safety, and who lives there. What the data shows.
Check a neighbourhood
Every neighbourhood has a page with its safety rank, what that rank measures and what it cannot tell you. Free, and no account.
Check a neighbourhood