Is This Toronto Neighbourhood Safe? How to Read the Score
Data freshness: Figures checked against the live PickYourPlace database on 2026-09-29. Crime is Toronto Police Service neighbourhood data through year-end 2025; population and demographics use the Statistics Canada 2021 Census.
When you are house-hunting in Toronto, a promising listing often comes with one question: is this area safe? It is the question almost everyone asks first, and it is the hardest one to answer well. Most of what we reach for (a headline, a Reddit thread, a single colour on a crime map) collapses a complicated place into a yes or a no. But a neighbourhood has a crime volume, a mix of incident types, a trend over time, and a set of things the data never sees at all. It is not safe or unsafe the way a switch is on or off.
PickYourPlace scores every Toronto neighbourhood for safety on a 0 to 100 scale, and a lot of buyers stop at that number. This post is about what sits underneath it. I will walk through what a Toronto safety score measures, read a real score for one neighbourhood line by line, explain what the year-over-year trend adds, and finish with the questions the score should send you into a viewing with.
What a Toronto safety score actually measures
The safety score in a Toronto Analyze report is a score out of 100, not a raw count, and it is not a rank either. It is built from measures that are each ranked against every other neighbourhood in the same city before they are weighted together. So the score always answers the question "compared to the rest of Toronto," never "compared to some universal idea of safe."
The score is a weighted composite. It blends reported crime volume with traffic-incident history, street-lighting coverage, distance to the nearest fire, police, and health services, and ambient noise, then weights crime most heavily. Because no neighbourhood leads on every one of those at once, the range is compressed, so a score in the high 60s is already strong, not a near-fail.
Underneath the single number, the report opens the crime figure into categories (assault, break and enter, auto theft, and others), each with its own rate per 1,000 residents and its own direction of travel. That breakdown is where the score stops being a label and starts being a description.
Reading one score line by line: Humewood-Cedarvale
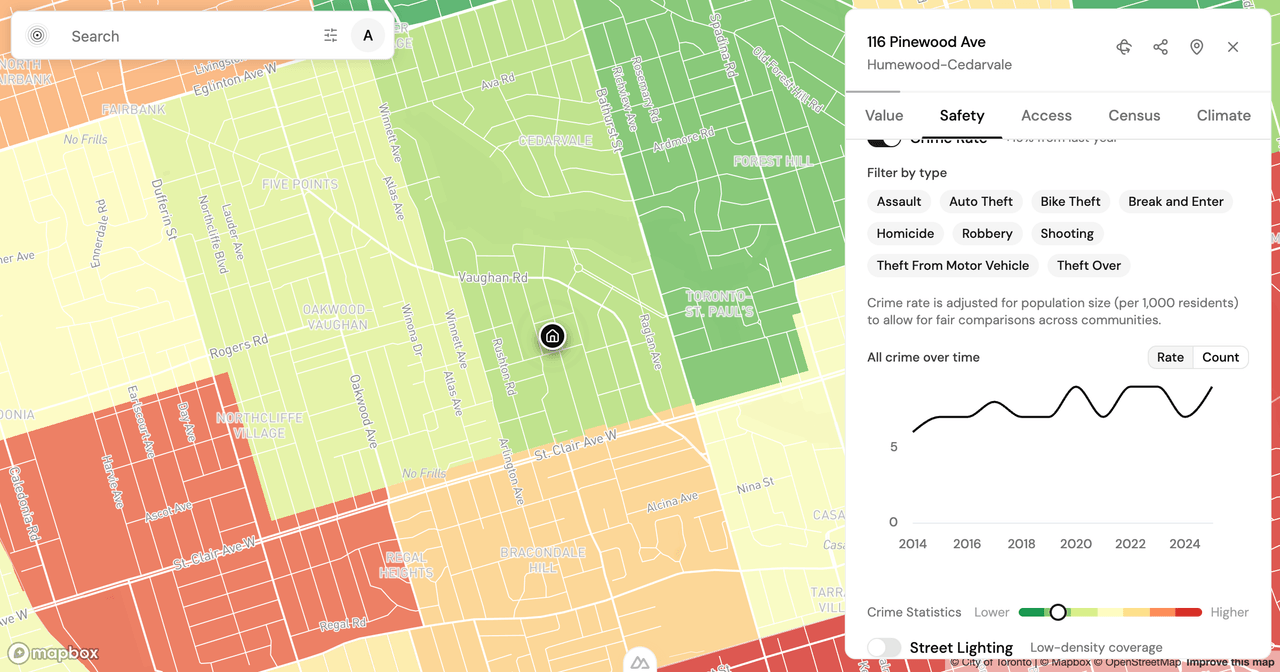
Take Humewood-Cedarvale, a neighbourhood on Toronto's midtown west side. Its safety score is 69. On its own, that number tells you almost nothing you can act on. The neighbourhood safety page gives the score and a highlighted measure; an Analyze report opens the detailed breakdown below.
The neighbourhood sits in the 21st percentile for crime volume (lower reported volume than 79% of Toronto neighbourhoods), based on 147 reported incidents in 2025, or 8.9 per 1,000 residents. That is the part of the picture that reads well. The complicating part is the trend: all-crime is up 19.1% year over year. A single score cannot hold both of those facts at once, but the report shows them side by side.
Split by category, the story gets more specific still. Assault is the largest category at 78 incidents (4.7 per 1,000), and it is up 57.4% year over year. Break and enter sits at 35 incidents (2.1 per 1,000), up 19.3%. Auto theft runs the other way, at 22 incidents (1.3 per 1,000), down 32.0%. Three categories, three different directions. "Is it safe?" has no honest single answer here, and the breakdown is what makes that visible.
What the trend line adds that the score hides
A safety score is a snapshot. It describes where a neighbourhood stands today relative to its peers, but on any given day it flattens time into a single position. The trend dimension puts time back in.
In Humewood-Cedarvale, the score and the trend point in opposite directions: low crime volume, but rising. That is not a contradiction to resolve. It is the kind of nuance to carry into a decision. A neighbourhood with a strong score and a falling trend is a different bet from one with the same score and a rising one, even though the number on the card is identical.
Two limits are worth stating plainly. Reported incidents miss whatever goes unreported, and annual data lags the very recent past. A score is a strong starting point, not the last word.
Using the score as a door, not a verdict
The most useful thing a safety score does is tell you what to ask next. Read as a door rather than a verdict, Humewood-Cedarvale's report turns into a short list of questions to bring to a viewing:
- Assault is the biggest category and it is rising. Is the increase concentrated on a few streets or a commercial strip, or spread across the neighbourhood? Walk it in the evening.
- Auto theft is falling. If you would park on the street, ask a few neighbours whether that matches what they have seen.
- The area is 64.5% renter and 35.3% owner, with a median age of 40 and 26 grocery and food options reachable in a 15-minute walk. Does that daily texture fit how you want to live?
None of those are answered by the number 69. All of them are prompted by what sits underneath it.
Where to start
A safety score is worth exactly as much as the questions it makes you ask. For any Toronto address, an Analyze report opens the same breakdown I walked through here (percentile, category split, year-over-year trend, and the census and walkability context around it), so you can see what a single label leaves out. New accounts are permanently free; check the Decision Pass and Professional plan for report access, and read the score the way it is meant to be read: as the first question, not the answer.
If you run it on your own shortlist, I would like to hear how it reads, so please reach out with anything that is unclear or missing.
Keep reading

Is Highland Park Calgary Safe? Reading the Inner-North Crime Data
Is Highland Park Calgary safe? We pulled the Calgary Police crime data for this inner-north community and read a safety score of 49 category by category.

Is Oakwood Village Toronto Safe? What the Crime Data Shows
Is Oakwood Village Toronto safe? We read the Toronto Police crime data by category and trend to show how to turn a safety score into a question you can act on.
Is Pelmo Park-Humberlea Safe? How to Read Northwest Toronto's Crime Data Before You Buy
Is Pelmo Park-Humberlea safe? We read Toronto's 2025 crime data by category and trend to show how to weigh a northwest Toronto safety score before you buy.
Check a neighbourhood
Every neighbourhood has a page with its safety rank, what that rank measures and what it cannot tell you. Free, and no account.
Check a neighbourhood