Is Trumpeter Edmonton Safe? What the Crime Data Shows
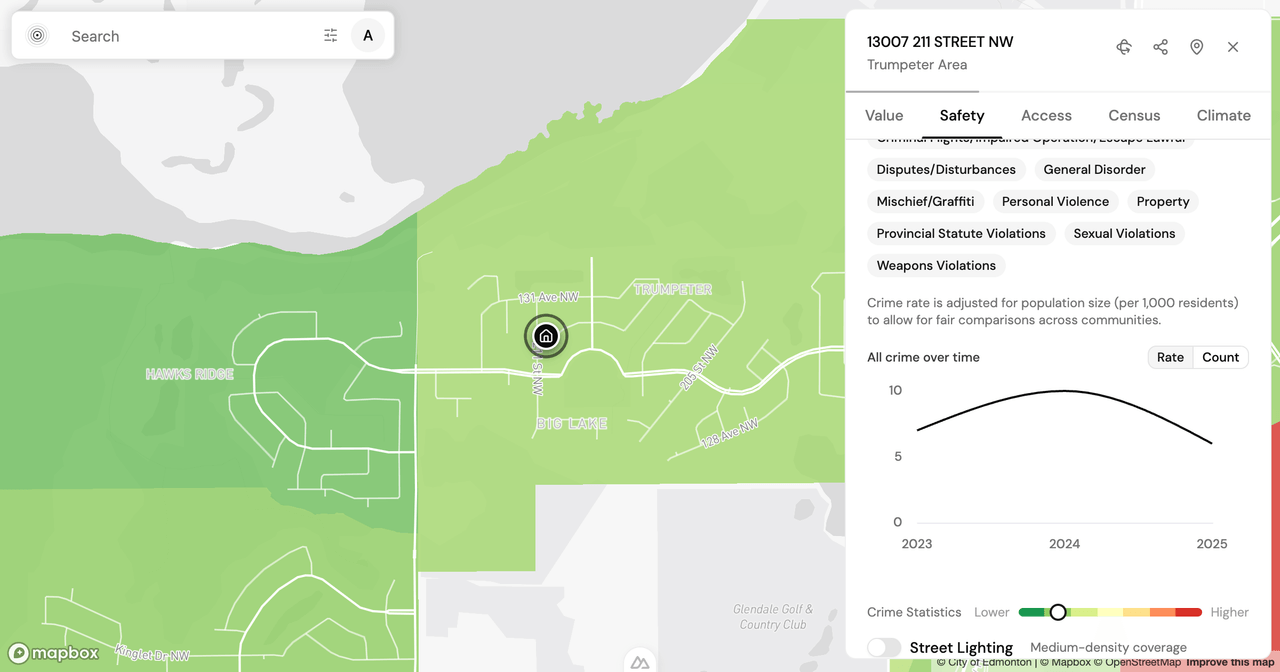
Data freshness: Edmonton Police Service community crime statistics through year-end 2025. Population and demographics from the Statistics Canada 2021 Census. Property values from the City of Edmonton 2026 assessment roll. Every Trumpeter figure below is pulled from the PickYourPlace database. See the sources note at the end.
You have found a house you like in Trumpeter, on Edmonton's northwest edge. The lot is bigger than anything the same budget buys closer in, the street is quiet, and the listing photos look new because most of the neighbourhood is. Then the question every buyer eventually asks arrives: is Trumpeter, Edmonton safe?
It is a fair question, and it is also the wrong first question. "Safe" is not one number. The honest version is: safe from what, compared to where, and moving in which direction? This post takes Trumpeter Area as a worked example and reads Edmonton Police Service's 2025 crime data one category at a time, so you can see what a single safety score captures and what it quietly leaves out.
A safety score is a starting point, not an answer
Every neighbourhood on PickYourPlace carries a composite safety score, a 0-to-100 number that blends several ranked components. It is useful for the same reason it is limited: it compresses a lot of detail into one figure. Two neighbourhoods can post the same reported crime volume and still be very different places to live, because the mix of categories and the direction of the trend differ.
Trumpeter is a clean illustration. Its crime-volume rank sits in the 18th percentile citywide, among the lowest in Edmonton (lower means less reported crime). Its composite safety score, though, is 60 out of 100. Those figures use different scales and cannot be subtracted. Read together, they show that the score is weighing something other than incident counts, and in Trumpeter's case those other components hold the composite below where crime volume alone would place it.
Trumpeter by the numbers
Here is what Edmonton Police recorded in Trumpeter Area for 2025:
- 31 reported incidents in total, or 5.9 per 1,000 residents.
- All-crime down 39.3% year over year, so the 2025 count sits well below the previous year's.
- Crime volume in the 18th percentile citywide, among the lowest-volume neighbourhoods in the city.
Thirty-one incidents across a full year is a low absolute number, and the direction is downward. That is the reassuring half of the picture. The next question is which incidents, because a neighbourhood's lived experience depends far more on category than on the headline count.
What kind of crime, and which way it is moving
Two categories account for most of Trumpeter's reported incidents:
- Property crime: 21 incidents (4.0 per 1,000), about two-thirds of the neighbourhood's total, and down 34.4% year over year.
- Mischief and graffiti: 3 incidents (0.6 per 1,000), down 62.7% year over year.
The shape here matters. Property crime is the dominant category, which is common in newer, car-dependent suburbs where most reported incidents involve vehicles and detached-home garages rather than people. Both leading categories fell sharply in 2025. A count that is both low and declining is a different signal than a low count creeping upward, and the trend is the part most "is X safe" conversations skip.
What the score weighs beyond incidents
If Trumpeter's crime volume is so low, why is its composite score 60 rather than near the top of the scale? Because the safety lens is not a crime counter. It blends reported crime with street lighting coverage, traffic-incident context, noise exposure, and proximity to police, fire, and health services. In a neighbourhood on the outer edge of the city, those access-and-infrastructure components can pull in a different direction than the crime numbers do.
That is not a knock on Trumpeter. It is a reminder that a mid-range composite alongside a low crime-volume percentile reflects several measures rather than incident counts alone. The only way to see which components help and which hold the score back is to open the breakdown itself rather than read the single number.
Reading the breakdown without turning it into a verdict
Scores are doors, not verdicts. An 18th-percentile crime volume does not make Trumpeter "the safe choice," and a composite of 60 does not make it "average and therefore fine." Both are prompts to look closer:
- If a low reported-crime count and a falling trend are what you are optimizing for, Trumpeter's 2025 numbers support a closer look.
- If you are weighing a longer emergency-response distance or thinner transit against that low crime volume, the composite is telling you to check those components directly for the specific address.
For the Calgary version of this same exercise, our breakdown of whether Beltline is safe walks a dense inner-city neighbourhood that sits at the opposite end of the trade-off: high reported crime, offset by strong emergency access.
See it for a specific Edmonton address
Neighbourhood data is one layer; the property in front of you is another. Trumpeter's median assessed value is $504,000 on the 2026 roll, up 22.0% over five years, and 94.7% of its homes are owner-occupied, the profile of an established owner-occupier suburb rather than a rental pocket. Those figures set context, but they describe the community, not the block.
The Trumpeter Area safety page gives you the neighbourhood-level view, and an Analyze report breaks the safety lens into its category, trend, and percentile components for any specific Edmonton address. When you provide a household profile, the report can also frame the safety context against your priorities. You can start from the Edmonton hub or see what each plan includes on the pricing page.
None of this decides the question for you, and it is not meant to. The data narrows it: Trumpeter reported few incidents in 2025, most of them property-related, and the trend fell across the board, while the composite score points you toward the non-crime factors worth checking for your exact address. If you have looked at Trumpeter or another Edmonton neighbourhood and think the data misses something, I would like to hear it. Tell me what is missing and which neighbourhoods to cover next.
Sources
- Crime data: Edmonton Police Service community-level incident statistics, pulled from the PickYourPlace database, with 2025 as the most recent complete year and year-over-year changes measured against 2024.
- Safety score: the PickYourPlace 0-to-100 safety lens, blended from percentile-ranked components including reported crime, street lighting, traffic context, noise, and proximity to police, fire, and health services.
- Population and demographics: Statistics Canada, 2021 Census, aggregated to neighbourhood polygons.
- Property values: City of Edmonton 2026 assessment roll, aggregated by neighbourhood.
Keep reading

Is Highland Park Calgary Safe? Reading the Inner-North Crime Data
Is Highland Park Calgary safe? We pulled the Calgary Police crime data for this inner-north community and read a safety score of 49 category by category.

Is Oakwood Village Toronto Safe? What the Crime Data Shows
Is Oakwood Village Toronto safe? We read the Toronto Police crime data by category and trend to show how to turn a safety score into a question you can act on.
Is Pelmo Park-Humberlea Safe? How to Read Northwest Toronto's Crime Data Before You Buy
Is Pelmo Park-Humberlea safe? We read Toronto's 2025 crime data by category and trend to show how to weigh a northwest Toronto safety score before you buy.
Check a neighbourhood
Every neighbourhood has a page with its safety rank, what that rank measures and what it cannot tell you. Free, and no account.
Check a neighbourhood