Who Lives in Toronto's Junction Area? The Census Data
Data freshness: Figures checked against the live PickYourPlace database on 2026-09-29. Demographics use the Statistics Canada 2021 Census; crime is Toronto Police Service neighbourhood data through year-end 2025.
When you are weighing a neighbourhood in Toronto's west end, you are really asking two questions at once. Can I afford a place here, and would my household actually fit in once we move in? The first question has an obvious data answer. The second one feels like a vibe read, the kind of thing you settle by scrolling a Reddit thread or asking a friend who lived nearby a decade ago. It does not have to be. The Junction Area, the stretch around Dundas Street West and Keele in Toronto's west end, has a census profile you can read the same way you would read an assessed value.
"Does this neighbourhood fit my household?" is a real question, and the census answers a good part of it. In this post, I will walk through what the census shows about who lives in the Junction Area, how that picture connects to the safety and accessibility data around it, and how to pull the same profile for any Toronto neighbourhood on your shortlist. I will also be clear about the line between what a census profile can tell you and what it cannot.
What the census shows about the Junction Area
Start with tenure, which is the census term for whether people own or rent their home. In the Junction Area, the split is 58.4% owner and 41.7% renter. That is a fairly balanced mix by Toronto standards: enough owners that a good share of households are settled long-term, enough renters that the area is not exclusively single-family and detached. If you are buying, that balance matters, because a neighbourhood that is almost entirely renter-occupied behaves differently from one that is almost entirely owned, in everything from turnover to the kind of housing stock on the market.
The median age is 39. Half the residents are older than 39, half are younger, which points to a neighbourhood weighted toward working-age adults rather than students or retirees. Average household size is 2.4 people. That number sits between a city of couples and a city of larger families, and it is the kind of figure worth comparing against your own household. If you are a family of four, 2.4 tells you that you would be on the larger side of typical here, which shapes everything from the size of the housing stock to who is on the local school run.
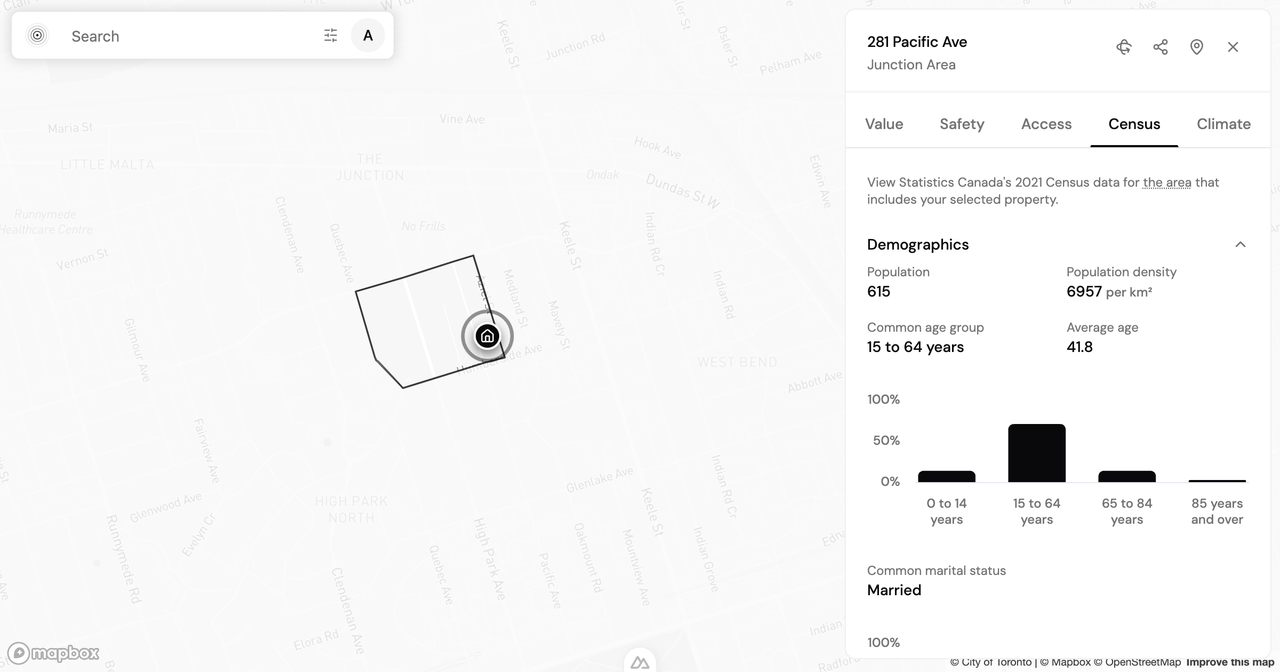
All of this comes from Statistics Canada census data, reported at the level of the dissemination area, which is the smallest geography for which Statistics Canada publishes the full set of census data: a few city blocks each. Rolling those small areas up to the neighbourhood gives you the Junction Area profile rather than a citywide average that would wash out its character.
How the demographics picture connects to safety and access
A demographics profile is more useful next to the other lenses than it is on its own. The Junction Area scores 74 out of 100 for accessibility, a weighted blend of access to everyday destinations and transit. Transit is stronger still, in the 85th percentile. A separate walking-reach measure adds context: 26 grocery and food options sit within a 15-minute walk. For a household that prioritizes errands on foot, that walkable density is often the reason to look here in the first place.
Safety scores lower, at 37 out of 100. That is a weighted composite of reported crime with traffic, lighting, noise, and access to emergency services, not a verdict, and not a statement that the area is safer than 37% of Toronto neighbourhoods. Behind that score, the 2025 crime data for the area shows total incidents down 18.9% year over year, with break and enter down 27.0% and assault down 7.8%, while theft from motor vehicles moved the other way, up 71.8%. Those are the trends the safety lens draws on. What the data cannot see is unreported incidents, or how a number that covers the whole neighbourhood plays out on one specific street. A score is a starting point for a closer look, not a substitute for one.
Reading a score as a door, not a verdict
The Junction Area's value score is 40 out of 100. It would be easy to read a number like that as a grade and move on. That is not what it is. Each lens score blends several measures, and no single figure shows the trade-offs that actually decide whether a place fits you. Here, the trade-off is legible: strong access and transit, a middling value score, and a safety score of 37. A household that prioritizes walkability reads that profile very differently from one that prioritizes a lower crime rate, and both are reading the same neighbourhood correctly.
This is why the census profile, and every lens score, is better treated as a door than an answer. A tenure split of 58.4% owner does not tell you whether your future neighbours will become friends. A median age of 39 does not tell you how many kids are on your block. What the numbers do is give you a defensible place to start, so your questions at the showing are sharper than "what's the area like?" If you want the full logic of how these scores are built, how neighbourhood scoring works walks through the lenses and the 0-to-100 scale in detail.
How to pull the census profile for any Toronto neighbourhood
You do not have to take my word for the Junction Area numbers. The neighbourhood page gives you a starting summary, and you can pull the same profile for anywhere on your shortlist in a few steps.
- Open the Junction Area census profile to see the Census score and a highlighted measure for the neighbourhood, or start from the Junction Area overview to see all five lenses side by side.
- To go deeper on a specific address rather than the whole neighbourhood, generate a full report in Analyze. It combines the census profile with property value, safety, accessibility, and climate data, and writes a plain-language summary comparing the address to the rest of the city.
- Repeat for the two or three neighbourhoods you are weighing against each other, and compare the profiles rather than the anecdotes.
Try it for yourself
The census will not tell you whether you will love living in the Junction Area. It will tell you who is already there, how many own versus rent, and how the neighbourhood scores on the things you can measure, so the parts you cannot measure are the only ones left to decide in person. That is a better place to start a home search than a stranger's opinion.
You can browse the map and neighbourhood scores now and create a permanent free account. Full reports come with a Decision Pass, one $129 CAD payment for one home search, valid for 90 days, or a Professional plan for people running searches for clients. See the plans and what each one includes when you are ready to go further.
I would love to hear whether this matched what you already knew about the Junction Area, or surprised you. If there is a Toronto neighbourhood you would like to see profiled next, let me know.
Keep reading

Is Highland Park Calgary Safe? Reading the Inner-North Crime Data
Is Highland Park Calgary safe? We pulled the Calgary Police crime data for this inner-north community and read a safety score of 49 category by category.

Is Oakwood Village Toronto Safe? What the Crime Data Shows
Is Oakwood Village Toronto safe? We read the Toronto Police crime data by category and trend to show how to turn a safety score into a question you can act on.
Is Pelmo Park-Humberlea Safe? How to Read Northwest Toronto's Crime Data Before You Buy
Is Pelmo Park-Humberlea safe? We read Toronto's 2025 crime data by category and trend to show how to weigh a northwest Toronto safety score before you buy.
Find my place
Say what matters to you and the whole city gets ranked against it, with what each place asks you to give up.
Find my place