Vancouver Climate Risk by Neighbourhood: Reading the Lens
Data freshness: Neighbourhood figures checked against the live PickYourPlace database on 2026-09-29. Climate uses the canonical area-weighted neighbourhood source, computed 2026-05-15. Property values use the 2026 BC Assessment roll; demographics use the Statistics Canada 2021 Census.
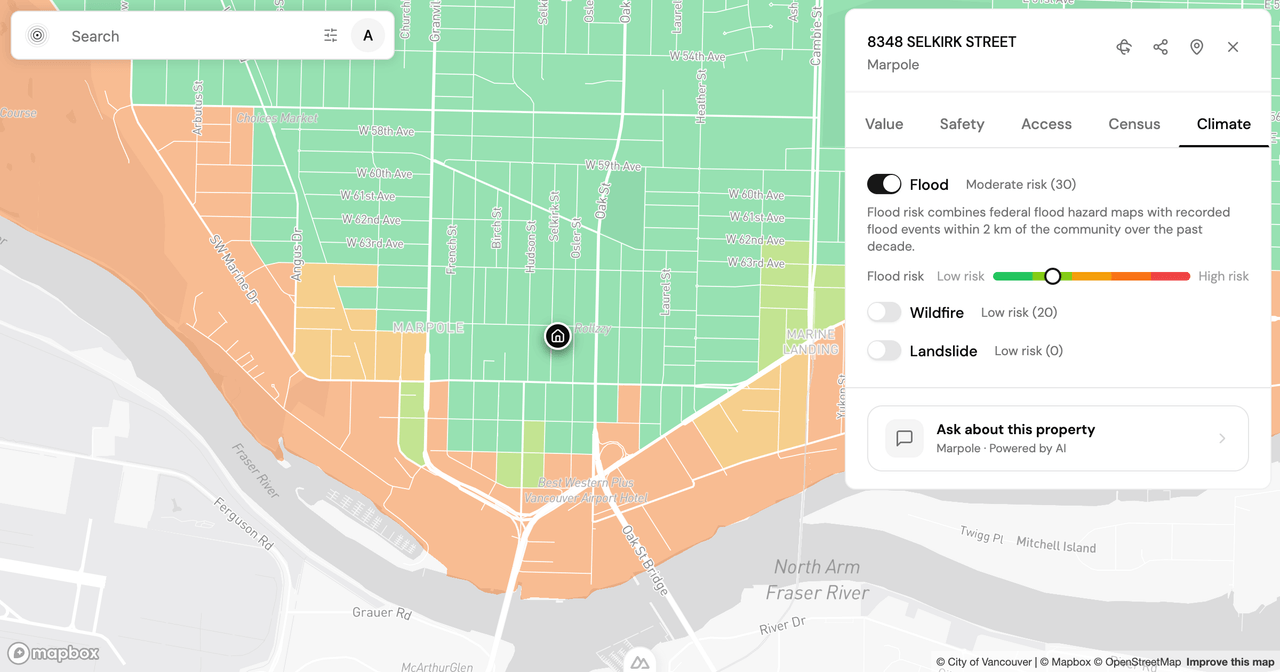
You have shortlisted an address in Marpole, on Vancouver's south edge where the streets slope down toward the Fraser River. The price works, the SkyTrain is a short walk, and then two questions arrive that no listing photo answers: how exposed is this block to flooding, and what happens here when wildfire smoke settles over the Lower Mainland for a week in August?
For years those questions sat at the back of a buyer's mind. After the wildfire seasons of 2017, 2018, 2021, and 2023, and the flooding that followed the November 2021 atmospheric rivers, they moved to the front. Climate exposure is now something Metro Vancouver buyers weigh before an offer, next to the $1,314,500 median assessed value a Marpole property carries on the 2026 BC Assessment roll. Here is what PickYourPlace's climate lens measures, what it shows for a Fraser-adjacent community like Marpole, and how to read it against the rest of a purchase decision.
Why climate exposure became a line item in a Vancouver purchase
Two hazards drive most of the concern here, and they behave differently. Wildfire smoke is regional: when it arrives, it degrades air quality across the whole city more or less evenly. Flood risk is intensely local. It depends on elevation, distance to the Fraser, and drainage, so two addresses a few blocks apart can sit at genuinely different exposure.
That locality is the reason a city-level statement is too coarse to price. "Vancouver floods" tells you nothing about a specific block, and neither does a headline about a bad smoke year. Elevation, the shape of the land between a lot and the river, and the drainage of the surrounding streets all move exposure over short distances, which is why a neighbourhood label alone cannot settle the question. What a buyer near the river actually needs is a per-location read, expressed on a consistent scale so one address can be compared with another. That is the job the climate lens is built for.
What the climate lens measures
Climate is a scored lens inside PickYourPlace, sitting alongside Value, Safety, Accessibility, and Census in both the Explore map and the Analyze report. Every score runs 0 to 100, where higher means lower modelled hazard. Scores are computed at the Dissemination Area level, the small Statistics Canada geography, and rolled up to the neighbourhood by area-weighted averaging.
The composite blends seven hazards: flood, wildfire, earthquake, landslide, radon, severe weather, and heat. Severe weather combines hail and tornado, weighted more toward hail. A few of these carry honest resolution limits. Radon, for example, is reported at Health-Region resolution rather than block by block, so it describes a broad area rather than one street. The report is explicit about that, and it grounds the severe-weather read in named historical events near the address rather than generic risk language.
Most hazards use current or historical data. Flood uses current susceptibility and historical events; it carries no future flood scenario. The climate methodology explains that boundary.
That boundary matters when you read a score. The lens tells you the hazard the data models on a neighbourhood scale. It is not a forecast of what will happen to one specific home, and it does not account for a property's own grading, foundation, or drainage work.
Reading Marpole's climate score
Marpole sits against the Fraser, which is exactly the kind of location where a flood sub-score does work a citywide average cannot. The composite climate score is the headline, but for a river-adjacent block the row worth opening first is flood, not the composite alone.
In the canonical neighbourhood data pulled on 2026-09-29, Marpole has a climate resilience score of 68.23 out of 100. Flood resilience is 69.90, and wildfire resilience is 80.22. The weakest sub-component is earthquake resilience at 9.59, not flood. These are area-weighted neighbourhood figures, not an assessment of the shortlisted lot. Explore displays the opposite risk framing, rounded: flood risk of 30 corresponds to flood resilience of 69.90.
Read the number as a resilience signal, not a verdict. The composite blends nationally ranked hazard measures; a lower score means higher modelled exposure. It does not mean a block is unsafe or that a purchase is a mistake. It means the flood or wildfire exposure there is worth a closer look, and worth a question to an inspector or insurer who can assess the specific home. To see how these composites are assembled from sub-scores, the neighbourhood scoring explainer walks through the method.
How the climate score sits next to value and safety
Marpole's other lenses give the climate number its context. Across Vancouver, the community scores 40 out of 100 on value, 31 on safety, and 21 on accessibility, with transit in the 13th percentile. Its assessed values have softened recently: down 3.8 per cent over five years and 8.0 per cent year over year on the 2026 roll. It is a mixed-tenure community too, with renters the majority at 58.5 per cent against 41.5 per cent owners, a median resident age of 42, and an average household of 2.3 people. For an agent briefing a client on Marpole, that tenure split is worth pairing with the climate read: a renter-heavy street and an owner considering a purchase are asking different questions of the same flood row.
Climate is a separate axis from all of these. A climate score does not mechanically move an assessed value in the model, and a strong value trend does not offset a flood exposure. The lenses are meant to be read together rather than collapsed into a single ranking. If flood exposure is the thing you care about most, weight the flood row heavily even where the price looks attractive; if commute and daily errands matter more, the accessibility and transit reads carry more of the decision. The data supports the trade-off you choose. It does not choose for you, and it is not a substitute for the professionals (an agent, an inspector, an insurer) who assess the individual property.
From the map to a per-address answer
The practical path runs in three steps. Start on the Explore map, open the climate lens over Vancouver, and look at the hazard pattern across the neighbourhoods on your list before you commit to any one address. This is the fast way to see, at a glance, which blocks near the river carry more flood exposure than others. The Marpole climate page gives the neighbourhood-level read for that community.
When an address makes your shortlist, run it through Analyze for the per-address report: the composite score, the per-hazard breakdown, and historical event counts for that location. Then, for the questions the report raises, the Ask advisor answers follow-ups grounded in the same data, from "has this area recorded hail events?" to "which hazards contribute most to this neighbourhood's climate exposure?"
The one thing worth doing today, before an offer rather than after, is to open the climate lens for the neighbourhoods you are weighing and compare the available hazard layers across them. Use Analyze for the fuller breakdown. Run Analyze on your top address, and take the report to your agent. It is a small step, and it puts a number on the two questions a listing photo will never answer.
Keep reading

Is Highland Park Calgary Safe? Reading the Inner-North Crime Data
Is Highland Park Calgary safe? We pulled the Calgary Police crime data for this inner-north community and read a safety score of 49 category by category.

Is Oakwood Village Toronto Safe? What the Crime Data Shows
Is Oakwood Village Toronto safe? We read the Toronto Police crime data by category and trend to show how to turn a safety score into a question you can act on.
Is Pelmo Park-Humberlea Safe? How to Read Northwest Toronto's Crime Data Before You Buy
Is Pelmo Park-Humberlea safe? We read Toronto's 2025 crime data by category and trend to show how to weigh a northwest Toronto safety score before you buy.
See where the data comes from
Every source, and the four rungs between a public record and a sentence about your life, each with what it cannot tell you.
See where the data comes from